On the 12th of the month, a couple can look at two decent paycheques and still wonder where the money went. Rent cleared, groceries cost more than expected, a few subscriptions renewed, and one car repair pushed the account below zero. A household budget calculator won't fix every cost, but it can show exactly which decisions created the shortfall.
The useful version doesn't need to be complicated. It needs after-tax income, realistic spending categories, planned savings, and a clear surplus or deficit. In a high-cost region, that clarity matters: Los Angeles-area households spent an average of $90,594 annually in 2023–24, or about $7,549 per month, with food, housing, and transportation accounting for 65.7% of spending, according to the California household cost overview.
Why a Simple Calculator Beats Another App
A dual-income couple in a mid-sized city downloaded three budgeting apps after their balance fell below zero during the second week of the month. Each app promised visibility. Each required setup, categorisation, notifications, and a new routine. Within a week, the couple stopped opening them and felt more discouraged than before.
The problem wasn't a lack of technology. They hadn't built a shared picture of what came in, what had to go out, and what could flex. A basic spreadsheet or sheet of paper might have worked better because it would force them to list income, fixed bills, variable spending, savings, and debt in one place.
Visibility before automation
A simple calculator makes the maths visible. You can see that a modest increase in groceries, insurance, commuting, or utilities may leave less room for dining out or savings. That pressure is particularly important in California, where the Joint Economic Committee estimated that households paid $1,278 more per month in December 2024 than in January 2021 for the same basket of goods and services, with cumulative extra spending of $38,353 per household over that period. The California inflation tracker breaks out the pressure across essentials.
The blunt truth is that a budget often breaks in ordinary categories, not dramatic purchases. A recurring fee, a higher grocery bill, and a changed insurance premium can steadily consume the money that used to fund savings.
A template you control
DIY budgeting also builds math literacy. You learn which costs are stable, which ones move with usage, and which annual bills need monthly sinking funds. You can adjust the template when income changes, without relying on bank linking or a paid app.
That doesn't mean automation is useless. It means automation works best after the household understands the categories it is automating. The next steps identify the inputs, apply the formulas, and work through real monthly examples.
What a Household Budget Calculator Needs as Input
A calculator is only as honest as its inputs. Start with after-tax income, then add every expense and goal that competes for that money.
Pull 90 days of bank and credit-card statements before choosing targets. One month can include an unusually low grocery bill or an unusually high repair, while a longer view reveals recurring charges and seasonal patterns.
Five input groups
Net income: Record each regular paycheque after tax and deductions. A Canadian household might enter CAD $4,800 from one earner and $3,200 from another. A US household might enter USD $5,200 and $3,600. Add side-hustle income and irregular payments separately, using a cautious average rather than assuming every payment will arrive.
Fixed expenses: Include rent or mortgage, property tax, strata fees, insurance, childcare, debt minimums, transit passes, phone, and internet. These bills usually change less often, but they still need review when contracts or premiums change.
Variable expenses: Capture groceries, utilities, fuel, dining, entertainment, clothing, and household purchases. Use actual statements, not an optimistic guess.
Savings goals: Add emergency savings, retirement contributions, planned travel, education, or another goal as a line item. Savings shouldn't be treated as whatever happens to remain.
Extra debt payments: Separate minimum payments from additional repayment toward high-interest debt. This shows whether the plan is maintaining debt or actively reducing it.
| Input category | What to include | Sample CA household (CAD) | Sample US household (USD) |
|---|---|---|---|
| Net income | Paycheques, side income, irregular payments | $4,800 + $3,200 | $5,200 + $3,600 |
| Fixed expenses | Housing, insurance, childcare, minimum debt payments, connectivity | Rent, insurance, phone, internet | Mortgage, insurance, childcare, phone |
| Variable expenses | Food, utilities, fuel, dining, clothing | Groceries and transit | Fuel, groceries and entertainment |
| Savings targets | Emergency fund, retirement, planned purchases | Retirement and emergency savings | Retirement and emergency savings |
| Debt lines | Minimums and extra repayment | Credit or loan payment | Student or credit debt payment |
For a fuller checklist of categories, use this household expenses list. Households comparing different ways to organise family finances can also browse family budgeting resources for additional planning ideas.
Once the inputs are complete, the calculator can turn them into a monthly plan rather than a list of disconnected bills.
The Formulas Behind a Working Household Budget
The core equation is straightforward:
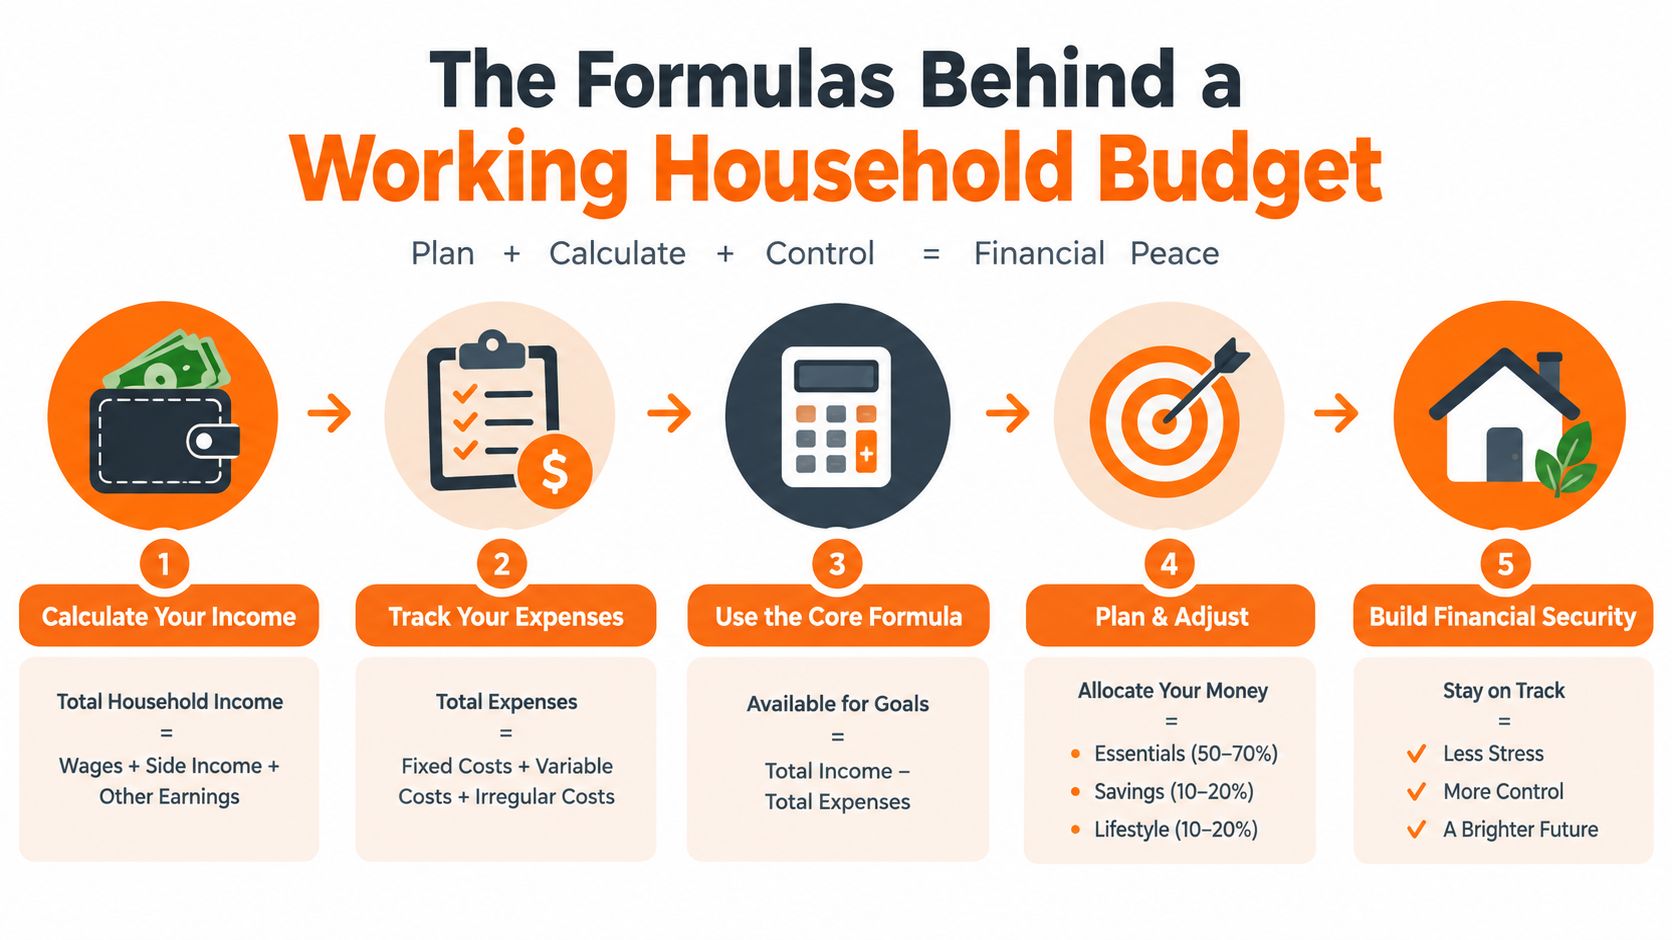
Surplus = Net income − (Fixed expenses + Variable expenses + Savings target + Extra debt payment)
If the result is positive, the household has planned room. If it's negative, the calculator has identified a problem that needs a decision, not a prettier dashboard.
Separate stable costs from flexible costs
Fixed expenses include rent, a mortgage payment, insurance premiums, minimum debt payments, and childcare. Variable expenses include groceries, fuel, utilities, dining, clothing, and entertainment. The distinction isn't perfect, but it helps you decide which lines can change quickly when cash flow tightens.
The popular 50/30/20 framework assigns 50% of after-tax income to needs, 30% to wants, and 20% to savings and debt repayment, as described by IG's budgeting guide. Needs can include housing, utilities, groceries, insurance, childcare, and transit. Wants may include dining out, streaming, hobbies, and travel. The final group includes retirement contributions and debt payoff.
Treat the framework as a diagnostic, not a law. A household facing high housing or childcare costs may need a different mix for a period.
Smooth irregular and changing costs
Convert annual bills into monthly lines by dividing the yearly amount by 12. A car insurance renewal, property tax bill, or holiday budget then becomes a monthly sinking fund instead of a surprise.
For variable spending, use a three-month rolling average. Add the last three months of a category and divide by three. This reduces the risk of copying an unusually cheap month and then running short later.
If essentials rise faster than wages, don't pretend the old savings target still fits. Lower a wants category first where possible, then recalculate the savings line so the plan reflects reality instead of showing a surplus that exists only on paper. The 50/30/20 budget rule guide offers another way to test the balance between needs, wants, savings, and debt.
A Worked Monthly Example for a Real Household
Consider two households using the same method. The Toronto couple has combined net income of CAD $7,800. The Ohio family has combined net income of USD $6,200. The currencies aren't directly comparable, so the point is the structure, not a cross-border cost comparison.
Each percentage below is calculated against that household's own net income. The buckets show how a household might classify the line for planning purposes.
| Category | Toronto couple (CAD) | % of net | Bucket | Ohio family (USD) | % of net | Bucket |
|---|---|---|---|---|---|---|
| Net income | $7,800 | 100% | Income | $6,200 | 100% | Income |
| Rent or mortgage | $2,650 | 34.0% | Need | $1,850 | 29.8% | Need |
| Utilities | $220 | 2.8% | Need | $310 | 5.0% | Need |
| Groceries | $900 | 11.5% | Need | $850 | 13.7% | Need |
| Transport | $650 | 8.3% | Need | $650 | 10.5% | Need |
| Insurance | $300 | 3.8% | Need | $420 | 6.8% | Need |
| Childcare | $0 | 0% | Need | $700 | 11.3% | Need |
| Debt minimums | $450 | 5.8% | Debt | $350 | 5.6% | Debt |
| Dining | $400 | 5.1% | Want | $250 | 4.0% | Want |
| Entertainment | $180 | 2.3% | Want | $160 | 2.6% | Want |
| Shopping | $250 | 3.2% | Want | $180 | 2.9% | Want |
| Savings target | $1,300 | 16.7% | Savings | $300 | 4.8% | Savings |
| Extra debt payment | $300 | 3.8% | Debt | $180 | 2.9% | Debt |
| Planned surplus | $200 | 2.6% | Buffer | $0 | 0% | Buffer |
The Toronto plan directs CAD $1,600 to savings and extra debt payment, but only CAD $200 remains as a buffer after the listed categories. The Ohio plan reaches zero after its savings and extra debt lines, leaving no planned room for an unexpected bill.
That doesn't prove either household is failing. It shows how childcare, housing, transport, and food can compress the discretionary slice. Statistics Canada reports that Canadian households spent an average of $67,126 on goods and services in 2021, a reminder that household spending is broad and substantial, not limited to rent and groceries. The Canadian spending overview provides that national reference point.
Splitting and Sharing a Household Budget Fairly
Fairness isn't always an equal dollar amount. It depends on income, usage, debt responsibilities, and the agreement both people can live with.
Using the Toronto couple's CAD $7,800 net income, suppose one partner earns 60% and the other earns 40%. The household can choose among three practical methods.
Compare the split methods
| Method | How it works | Best fit |
|---|---|---|
| Equal split | Each partner pays half of shared costs | Similar incomes and similar personal obligations |
| Proportional split | Each partner contributes according to income share | Different earnings with shared priorities |
| Usage-based split | The person creating a cost carries more of it | Uneven transport, subscriptions, or personal services |
With a proportional method, the higher earner contributes 60% of shared costs and the other partner contributes 40%. If shared costs total CAD $5,000, their contributions would be CAD $3,000 and CAD $2,000. A usage-based method might assign a personal vehicle cost to the partner who drives it, while splitting housing and groceries separately.
A joint account can simplify shared rent, food, utilities, and goals. Separate tracking can preserve independence for personal purchases. Uneven debt loads deserve an explicit agreement: decide whether debt is personal, shared, or temporarily supported by the household, then put that decision into the calculator.
For rent-only arrangements, a fair rent division tool can help compare contribution methods before you set the household template.
Keep the meeting short
- Use one shared view: Review the same numbers, not two competing spreadsheets.
- Discuss variances, not blame: Ask what changed and whether the category needs a new target.
- Finish with decisions: Assign the next action, owner, and date before ending the meeting.
A budget template for couples can give partners a starting structure. The important choice is made before the first month closes: decide what “fair” means for this household.
Common Budgeting Pitfalls and How to Avoid Them
Most budget failures don't come from difficult maths. They come from assumptions that sound reasonable until the month gets busy.
The five common breaks
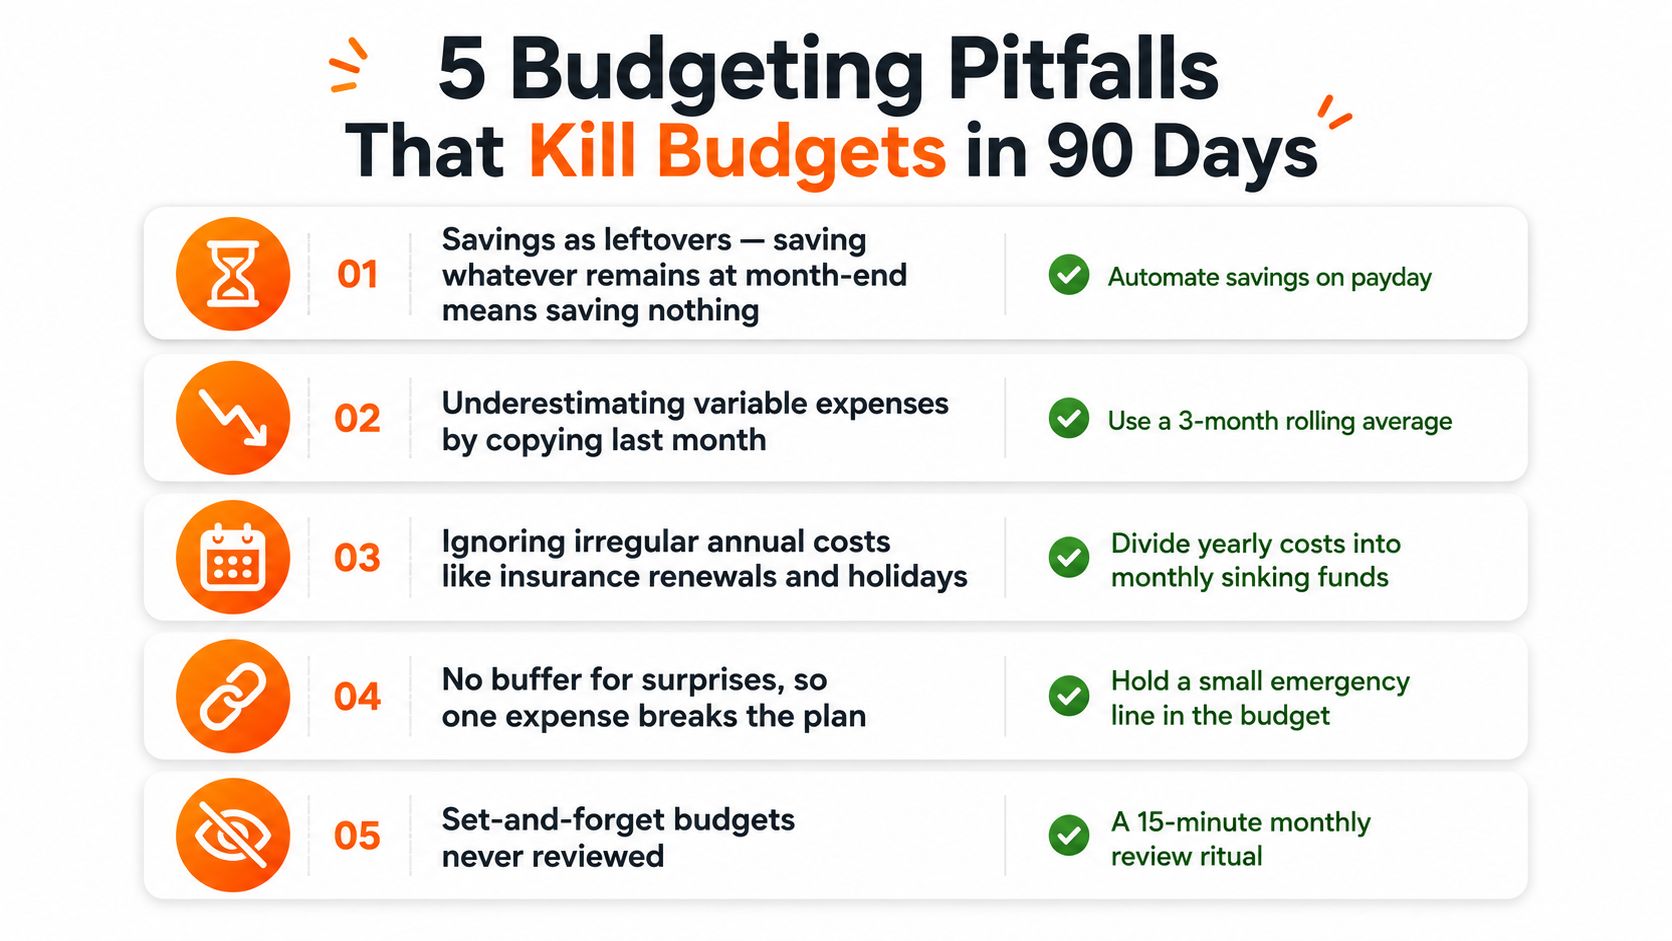
Savings become leftovers. If savings happens only after spending, the amount is whatever survived. Put the goal into the calculator first, then schedule a realistic transfer around payday.
Last month becomes the forecast. One month can hide a seasonal grocery bill, repair, or social event. Use the rolling average described earlier for variable categories.
Small recurring charges disappear. Subscriptions, app fees, delivery memberships, service add-ons, and duplicate charges may each look minor. Together, they can crowd out a goal. Audit recurring charges regularly and cancel anything the household no longer uses.
The plan never changes. A new rent amount, changed income, new childcare arrangement, or major life event requires a recalculation. A budget isn't a permanent verdict.
Gross pay creates false comfort. Budget from net pay, the money available after tax and deductions. Gross income can make a plan appear comfortable when the deposit reaching the household account is lower.
Statistics Canada's household spending instruments include utilities, communications, receipts, taxes, tips, and discounted purchases, which illustrates why a useful budget must capture more than broad categories. The household spending information also helps explain why telecom and recurring micro-expenses deserve their own review.
Practical rule: If a charge repeats, give it a line. If a bill arrives annually, give it a monthly sinking fund. If income changes, rebuild the plan.
A budget built once and ignored is just a spreadsheet. The review matters because essentials can absorb nearly all new income, leaving a household with a balanced-looking plan but little actual breathing room.
How Fintrack Automates the Whole Process
A calculator teaches the structure. Automation reduces the work of keeping that structure current.
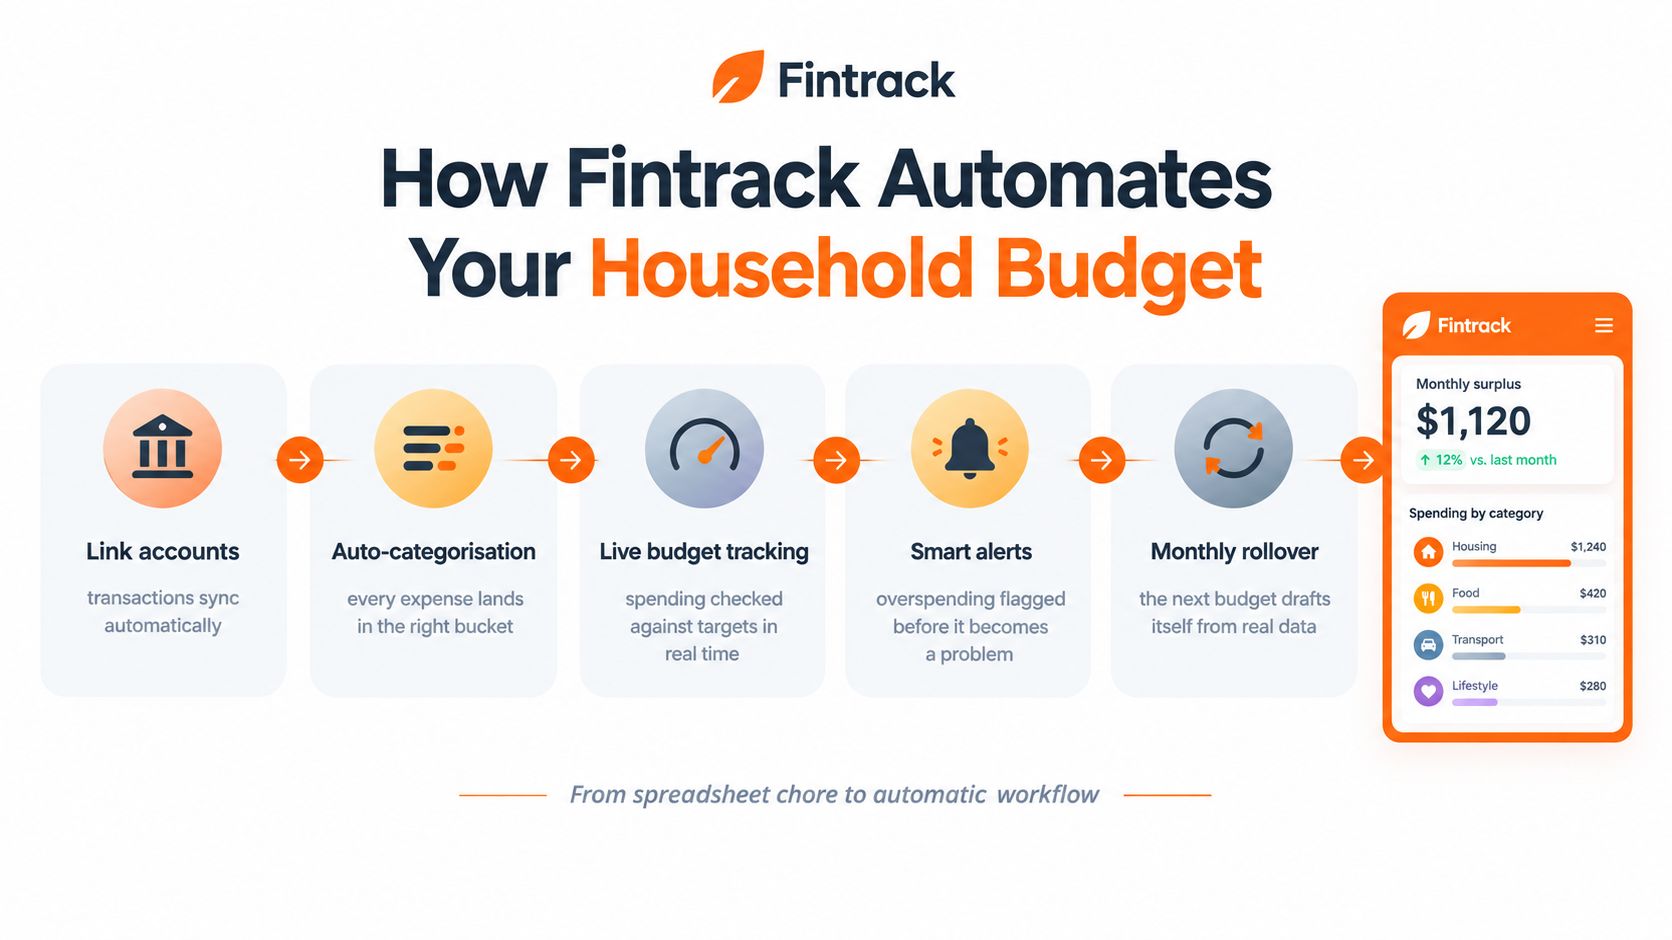
Fintrack can connect accounts and categorise transactions into the same practical inputs used above: income, fixed bills, variable spending, savings targets, and debt payments. It also supports manual entry without a bank connection, which matters for people who prefer to add transactions themselves or want to include cash spending.
From entries to household visibility
A household view can bring two members' accounts, budgets, and goals into one place. That reduces the need to reconcile separate lists at the kitchen table, while still allowing each person to retain visibility into personal spending.
Automatic categorisation isn't infallible, so review matters. The automatic expense categorisation feature helps place transactions into spending buckets, but households should correct unclear merchants and unusual purchases rather than accept every label without checking.
Real-time budget tracking can show whether a category is approaching its limit. Alerts can draw attention to unusual activity, duplicate charges, or spending that may put a fixed obligation at risk. The point isn't to remove judgement. It's to surface the issue before the household discovers it through a negative balance.
Recurring charges and unused value
Subscription detection addresses one of the easiest items to miss in a manual budget. It can flag duplicate or forgotten recurring charges so the household can decide whether each one still earns its place.
Fintrack's Benefits Wallet can also surface items such as cashback, unused credits, loyalty points, discounts, and expiring offers. Those features don't replace a spending plan, and they won't make an unaffordable bill affordable. They can, however, help a household notice value that would otherwise be overlooked.
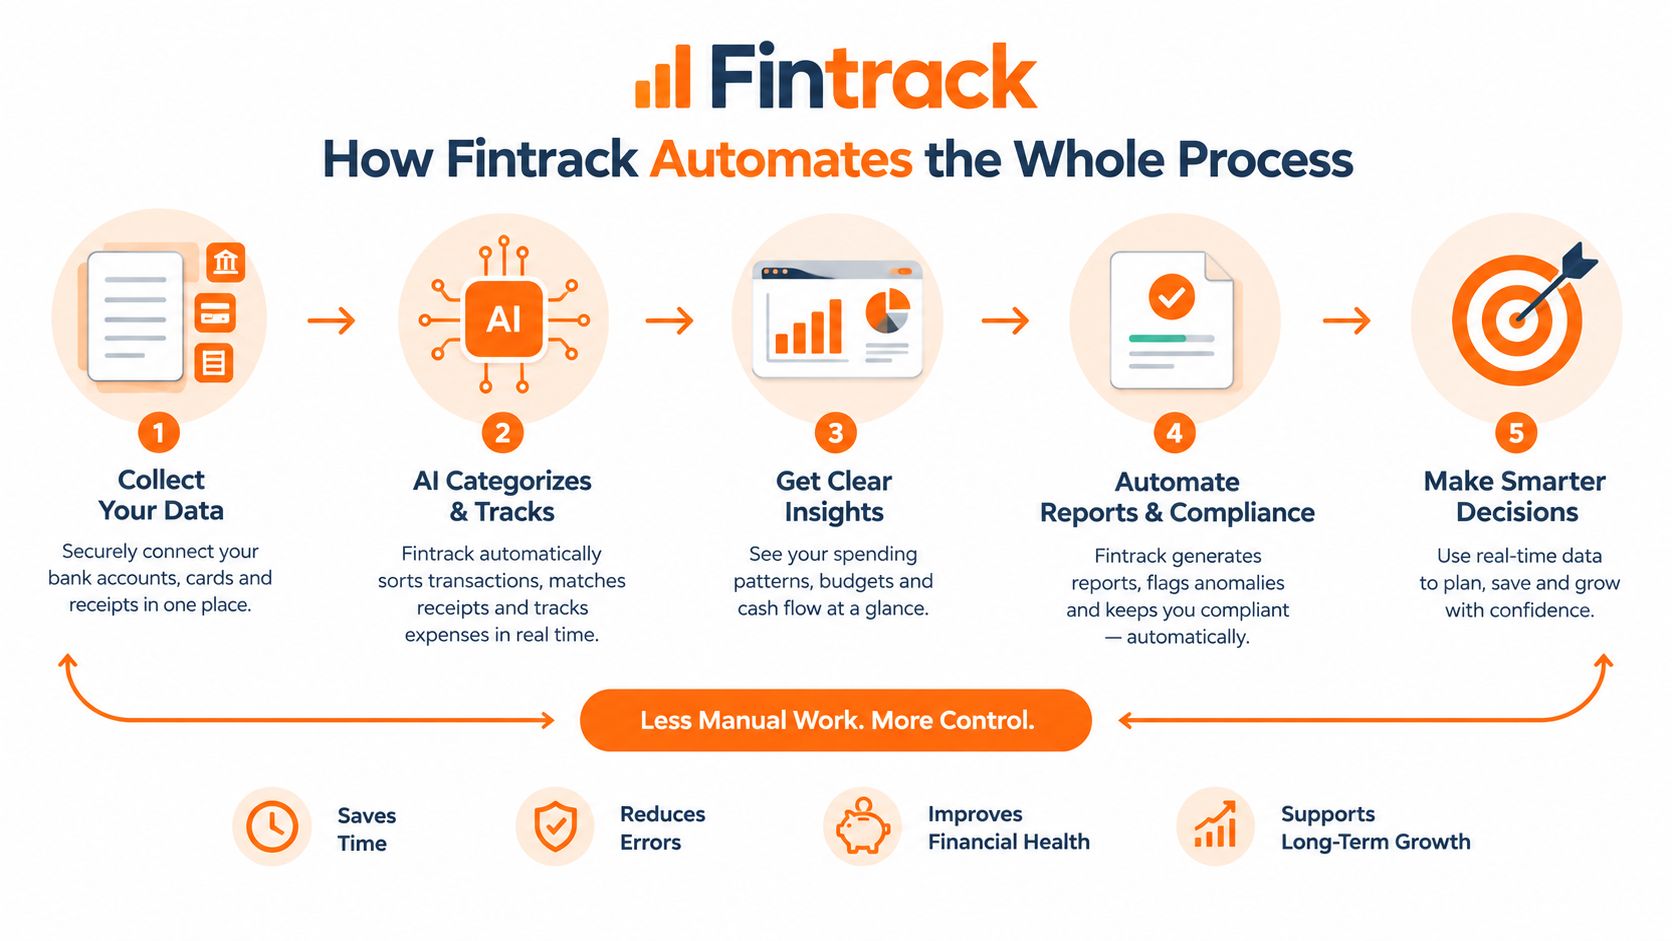
Canada's Financial Consumer Agency describes the basic budget process as adding monthly income, adding monthly expenses, then subtracting expenses from income to find a surplus or deficit. Its budget planner follows that same core logic by collecting income, savings, and expenses before calculating the remaining balance. Fintrack applies the same foundation with ongoing tracking and household coordination.
Automation won't decide whether to reduce dining, renegotiate a bill, or accept a lower savings target during a difficult month. It can make the numbers easier to see, the recurring charges easier to find, and the next review easier to complete.
If you want to move from a one-time spreadsheet to a living household plan, Fintrack brings budgets, spending, goals, alerts, and shared household visibility into one place. Add your own numbers, choose manual entry or account connections, and use the resulting view for your next short money review.