Meta description: Learn what trend analysis is in personal finance, how to spot spending patterns over time, and how to use category trends to make better budget decisions.
You check your spending at the end of the month and nothing looks dramatic. Groceries were a bit higher. Dining out crept up. A streaming charge appeared that you barely noticed. Your total spending didn't explode, so you move on.
Then two or three months later, your budget feels off. You're not sure why.
That's where trend analysis helps. Instead of treating each month like a separate event, it looks at your money over time. It helps you spot quiet shifts before they become expensive habits, especially in categories like takeout, subscriptions, transport, and everyday essentials.
For households in Canada and the United States, that matters more than it used to. In Canada, for example, the typical household basket of goods and services had risen by about 15% since the last quarter of 2019, and food, shelter, and transportation drove more than three-quarters of that inflation over the period, according to the Parliamentary Budget Officer. If your spending is rising, trend analysis helps you ask the right question: is this a personal habit change, a price change, or both?
Why Your Budget Keeps Surprising You Each Month
October ends, and you review your card statements.
Groceries are up a little from September. Dining out is up again. One streaming service renewed at a higher price, and another trial turned into a paid plan. None of those changes feels serious on its own. Together, they push your month in a new direction.
That's how most budget problems start. Not with a blow-up month, but with a slow tilt.
Small changes hide when you only review one month
A single-month budget review usually asks one question: did I stay under the limit?
That question matters, but it misses a lot. If groceries rose modestly, dining out edged up, and subscriptions added one more recurring charge, you may still land near your monthly target. The problem is that your baseline has shifted.
A good expense breakdown by category makes this visible. Once you separate your spending into buckets, you can see whether the issue is one large bill or several small increases moving in the same direction.
When your budget feels unpredictable, the cause is often gradual drift, not a single bad decision.
Your budget is a moving picture, not a still frame
Think of a photo versus a video. A photo can show that one month was high or low. A video shows whether your spending is steadily climbing, flattening, or easing.
That's the basic idea behind trend analysis. It helps you stop reacting to isolated numbers and start noticing patterns.
This matters in real households because spending rarely changes all at once. People order takeout more often during busy weeks. Prices on essentials rise slowly. Subscription costs layer in one charge at a time. Without a trend view, those changes stay hidden until your cash flow starts feeling tighter.
What Trend Analysis Actually Means in Plain English
What is trend analysis? In plain English, it means comparing the same number across several time periods so you can see the direction it's moving.
In personal finance, that number could be your grocery spending, your total subscription cost, your monthly transport bill, or your overall spending. The point isn't just to ask what happened this month. It's to ask whether this month is part of a pattern.
Snapshot budgeting versus trend thinking
Snapshot budgeting looks at one frame. It asks, “Did I stay under budget this month?”
Trend analysis asks a different question: “Is this month part of a slope?”
That difference matters because a month can be over budget for a harmless reason, like an annual bill, or under budget for a misleading reason, like delayed purchases that show up later. Trend thinking gives context.
A simple analogy that makes it click
Spending behaves a lot like the shoreline. Waves move in and out all day. If you only watch one wave, you can't tell whether the tide is rising or falling.
Your money works the same way. A single grocery trip, a weekend out, or one utility bill can bounce around. The underlying trend tells you whether your usual level of spending is changing.
Statistics agencies use this same logic when they smooth monthly data to reveal the longer-term movement underneath short-run volatility. Statistics Canada describes trend-cycle analysis as a smoothed version of a seasonally adjusted series that reveals longer-term movement and changes in direction, using weighted moving averages for monthly series with enough observations in its trend-cycle analysis note.
Two words to keep in mind
When you learn what trend analysis is, two terms make everything easier:
- Baseline means your typical level. If your household usually spends around the same amount on groceries, that's your baseline.
- Trajectory means the direction over time. Is the category rising, flat, or falling?
If you can identify those two things, you can read most spending patterns clearly.
For a related concept, financial forecasting takes those patterns and uses them to estimate what might happen next.
The Main Methods Behind Trend Analysis
You don't need advanced statistics to use trend analysis at home. A few simple methods do most of the work.
Some methods are better for spotting a sudden change. Others are better for separating a real pattern from noise. In Canadian public data, that distinction matters a lot. For example, Statistics Canada reported that household spending rose 0.4% in Q1 2026 after a 0.7% increase in Q4 2025, while TD's card-spending tracker showed 0.8% three-month average growth and 5.0% year-on-year growth during the same period in the Statistics Canada daily release. Same period, different lens.
Four practical ways to analyse a spending trend
| Method | How It Works | Best Use Case | Limitation |
|---|---|---|---|
| Month-over-month | Compare one month with the previous month | Spotting fresh changes in a category like dining out | Can overreact to one unusual month |
| Moving average | Average several recent months together | Smoothing noisy categories like groceries or fuel | Slower to show sudden turns |
| Year-over-year | Compare the same month across different years | Handling seasonality like holidays or summer travel | Needs older records |
| Baseline comparison | Compare each month to your usual level or budget cap | Seeing drift from your normal spending pattern | Your baseline may need updating |
How each method looks in real life
Month-over-month is the easiest starting point. If dining out rises from one month to the next, you notice it quickly. This is useful when you want early warning.
Moving averages help when a category bounces around. If your grocery spending changes week to week, a three-month average gives you a cleaner view. It's the household version of smoothing out waves so you can see the tide.
Practical rule: If a category is noisy, don't react to one month until you've looked at the recent average.
Year-over-year is useful when spending has a seasonal rhythm. December gift shopping and summer travel don't mean your day-to-day habits changed. Comparing the same month across years gives better context.
Baseline comparison is often the most useful for budgeting. You compare each month against your typical amount or your planned cap. If subscriptions keep landing above your baseline, something has changed even if each individual increase looks small.
If you want a deeper planning angle, these budget forecasting methods connect spending trends to future budget decisions.
How to Run Trend Analysis on Your Own Finances
You can do this with a spreadsheet, a notes app, or a tracking tool. The method matters more than the software.
Start with a short window and consistent categories
Pull three to six months of transactions from your bank statements, card exports, or budgeting app. You don't need a perfect multi-year archive to begin. You need enough history to see direction.
Then group your spending into stable categories such as:
- Essentials: groceries, housing, utilities
- Getting around: fuel, transit, parking, rideshare
- Lifestyle spending: dining out, entertainment, shopping
- Recurring charges: subscriptions, memberships, app renewals
Keep those categories consistent each month. If you change the labels every time, your trend line becomes hard to trust.
Run a simple monthly review
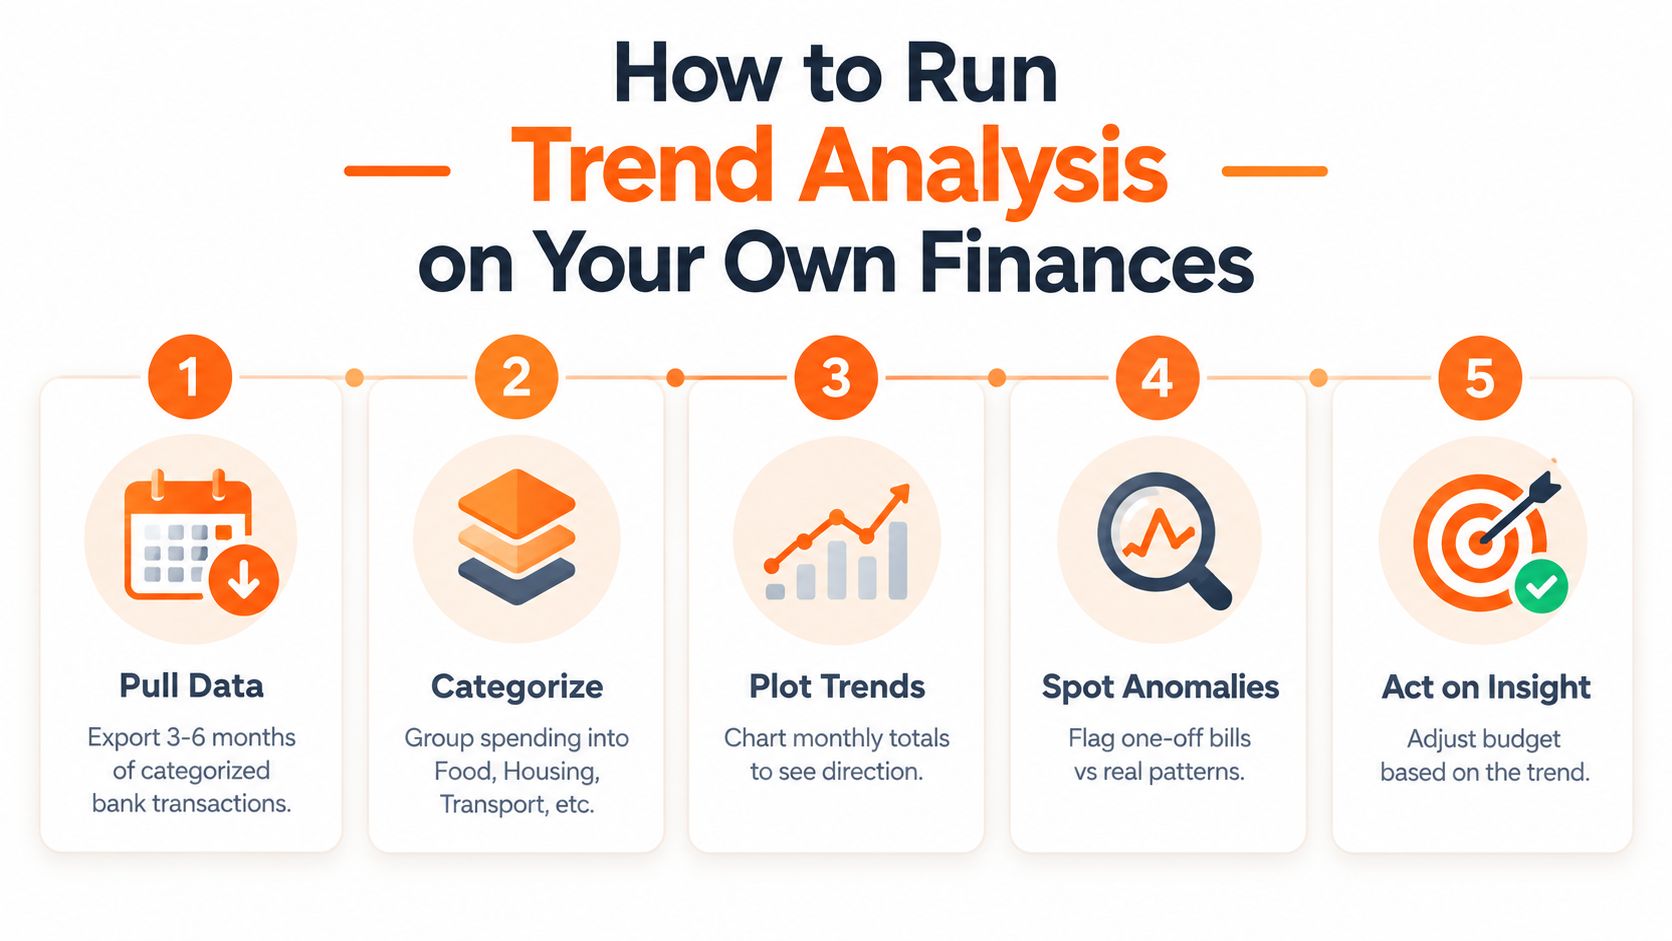
Use this five-step routine:
- Pull the data. Export recent transactions.
- Group the spending. Keep the same category names each month.
- Total each category. Add up monthly spending by category and overall.
- Smooth the noise. Look at month-to-month changes and a rolling average.
- Mark turning points. Note where a category clearly changes direction.
This is also where it helps to understand cash flow, not just category totals. If you want a practical companion to this exercise, the Wealth Collective guide gives a useful overview of how money timing affects financial decisions.
Look for drift, not perfection
Once your categories are totalled, compare each one against its usual level. You're looking for patterns like:
- A steady climb: often shows habit drift or price pressure
- A sudden jump that stays high: may signal a new baseline
- A one-off spike: often doesn't require a budget change
Write one line beside each major movement. “More takeout during busy work weeks” is enough. “Insurance renewal” is enough. That note helps you separate a real trend from random noise later.
For ongoing reviews, tracking income and expenses consistently makes the trend much easier to read.
A Real Example With Three Months of Household Spending
Here's what trend analysis looks like when total spending seems steady but the inside of the budget is changing.
Three-Month Household Spending by Category
| Category | Month 1 | Month 2 | Month 3 | Trend |
|---|---|---|---|---|
| Total spending | $3,800 | $3,850 | $3,900 | Mostly flat with a mild rise |
| Groceries | $720 | $735 | $740 | Stable and healthy |
| Dining out | $180 | $260 | $340 | Strong upward warning trend |
| Streaming subscriptions | $42 | $58 | $71 | Clear subscription creep |
What the numbers are really saying
At first glance, the household looks fine. Total spending only moves a little across the three months. If you stopped there, you might conclude everything is under control.
But category-level review tells a different story.
Groceries are fairly steady. That line rises gently and looks normal. This is what a healthy pattern often looks like.
Dining out is different. The jump keeps building across each month. That often means a behaviour change, not a one-time event. Maybe the family got busier. Maybe takeout became the default on weekends. Either way, the category is shifting.
A flat total can hide a rising habit in one category and a squeeze somewhere else.
Streaming subscriptions tell another common story. The totals are smaller, but the direction is obvious. A new service here, a price increase there, and a trial that never got cancelled can reset your baseline.
A budget versus actual dashboard is useful here because it shows whether a category is just over plan once, or whether it's building a pattern you need to address.
Common Trend Analysis Mistakes and Better Habits
People usually don't misread their budget because they're careless. They misread it because the wrong comparison is easy.
Four mistakes that distort the picture
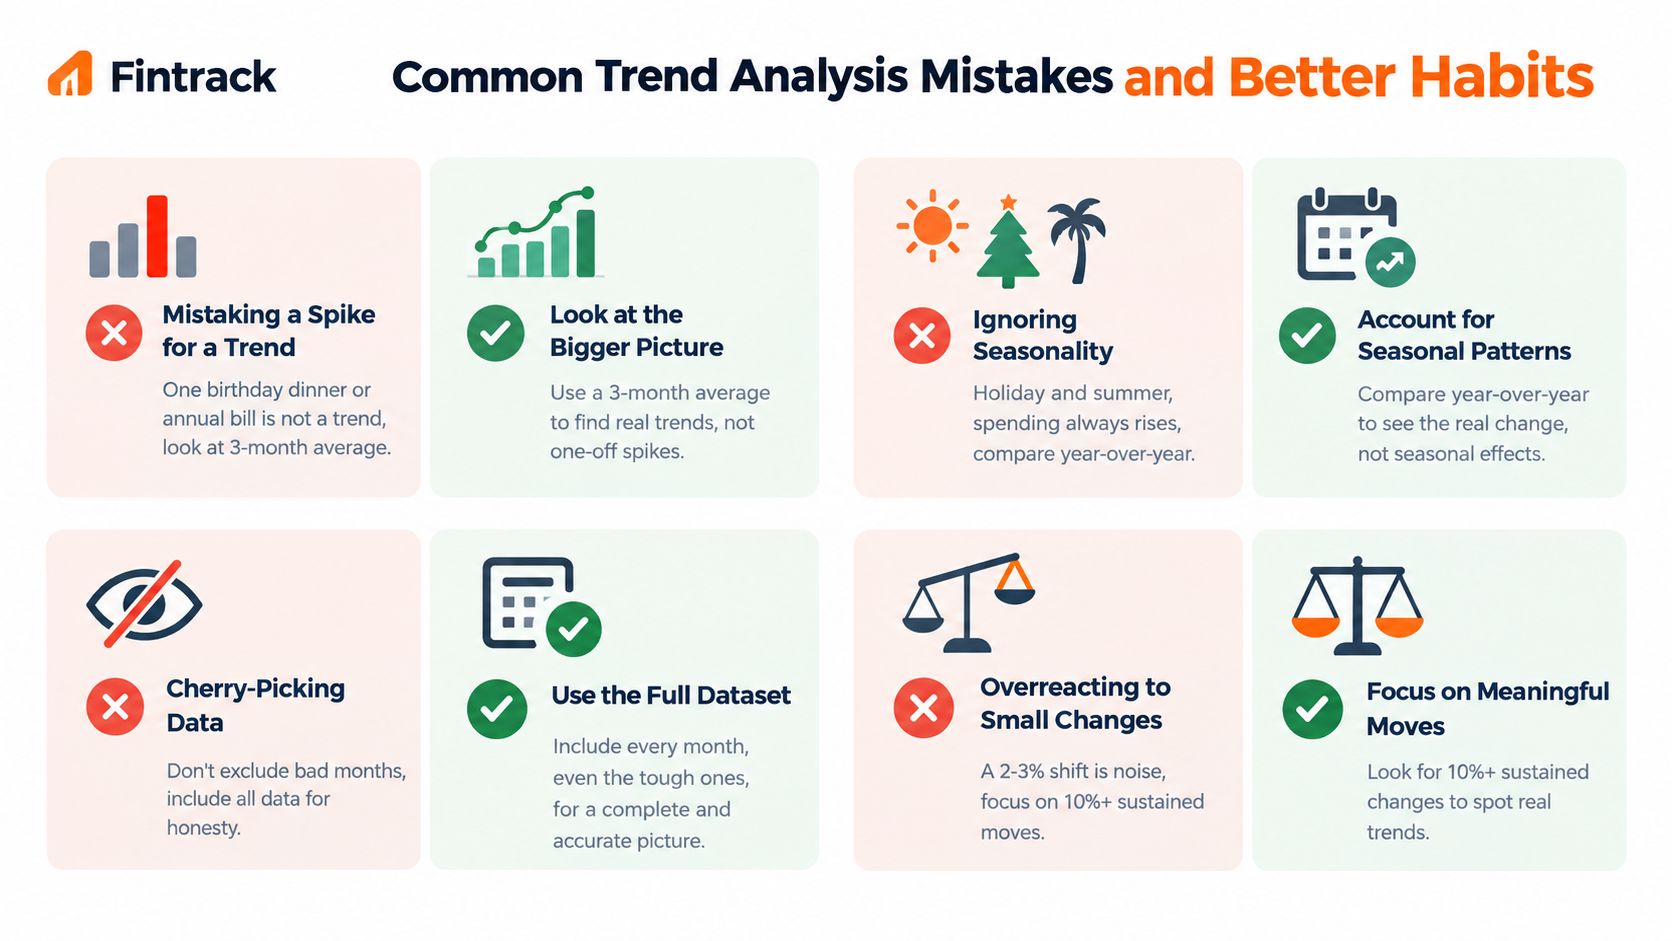
- Treating one bad month as a trend: One birthday dinner, one repair, or one annual premium can make a category look worse than it is.
- Ignoring inflation: Sometimes your spending rises because prices did, not because your habits changed.
- Watching only the total: Total spending can look steady while one category swells underneath.
- Assuming subscriptions stay fixed: Small recurring charges often change the baseline.
Better habits that make trend analysis useful
If you want a cleaner read, use a rolling average before reacting to a spike.
If you're trying to understand price pressure in Canada, it helps to compare your spending to inflation context. Statistics Canada reports that the Consumer Price Index rose 3.0% year over year in August 2026, with the 2025 annual average CPI at 2.1% and the index level at 164.2 on its Consumer Price Index page. That doesn't explain every category change in your budget, but it gives you a benchmark for the overall price environment.
Also remember that trend analysis works best at the category level. A household can hold total spending fairly steady while cutting one area to fund another. If you only track the total, you miss the trade-off.
Building a Monthly Trend Routine That Sticks
A good trend routine is short enough to repeat.
Keep the routine simple
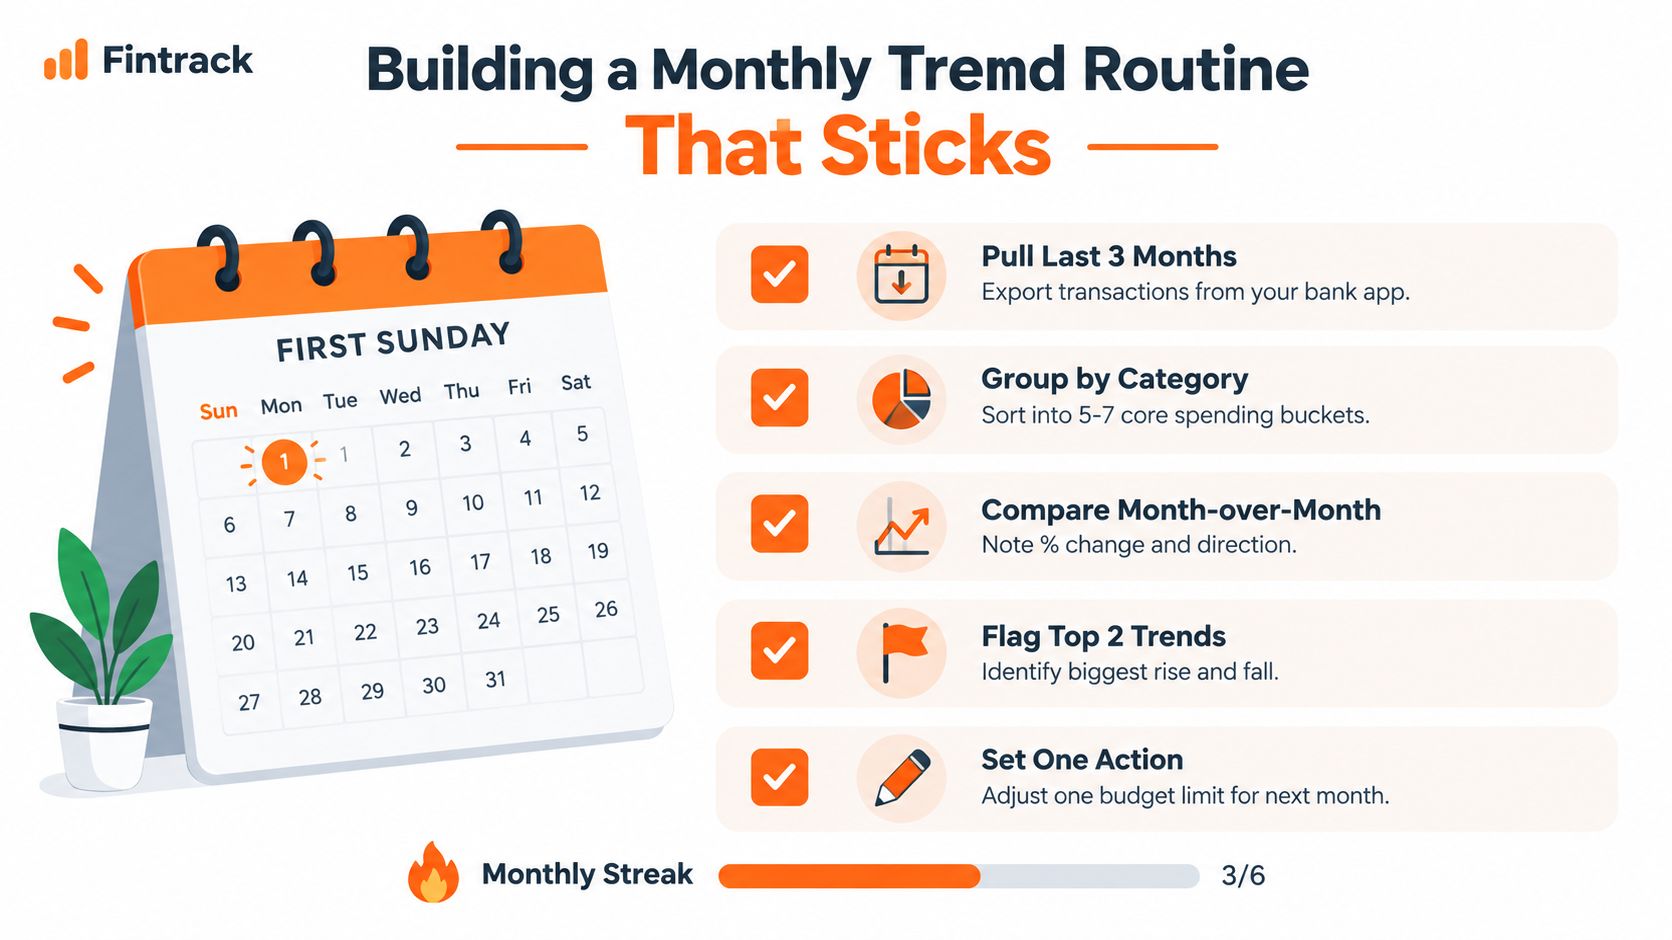
Pick one day each month, such as the first Sunday. Then do the same review in the same order every time:
- Pull the last few months: gather recent transactions
- Group spending by category: keep your buckets stable
- Compare periods: look at the prior month and the same month last year if you have it
- Flag the biggest movers: focus on categories that clearly changed direction
- Set one action: cancel, cap, reduce, or plan ahead
Add a brief money conversation if you share expenses with a partner or family member. If rent and shared bills are part of that discussion, this overview of rent splitting apps with Divvy is a helpful example of how households can make recurring costs easier to manage together.
Remove the friction that usually kills the habit
Most people don't quit because the idea is bad. They quit because manual review takes too long.
That's where a tool can help. Fintrack can group transactions, show category shifts over time, and surface changes in recurring spending without requiring a bank connection, which is especially useful for Canadian users who prefer manual entry. If you want to apply what you've learned here, the most useful next step is exploring its transaction tracking and category insights so you can review trends without rebuilding the same spreadsheet every month.
If you want one place to spot category drift, recurring charges, and month-to-month spending changes, Fintrack gives you a clearer view of your money without making you do all the sorting by hand. It's a practical way to turn trend analysis from a one-time exercise into a monthly habit you can keep.