
Your paycheck arrives, the rent or mortgage payment goes out, groceries follow, and a few smaller charges seem to disappear in between. By the time the next paycheque is due, you know the money is gone, but you can't clearly explain where it went.
An expense breakdown turns that feeling into a readable picture. It shows what you spent, which categories absorbed the most money, and where your next budget decision should start.
What an Expense Breakdown Actually Means
An expense breakdown is a structured record of your spending over a set period, usually a month. You list each expense, place it in a category such as housing, groceries, transit, dining, debt, or subscriptions, then add the category total and its share of your income or total spending.
That last step matters. A bank statement may show every transaction, but it makes you do the sorting in your head. A breakdown groups the transactions so you can see that several grocery trips formed one meaningful total, or that a collection of small recurring charges is taking more room than expected.
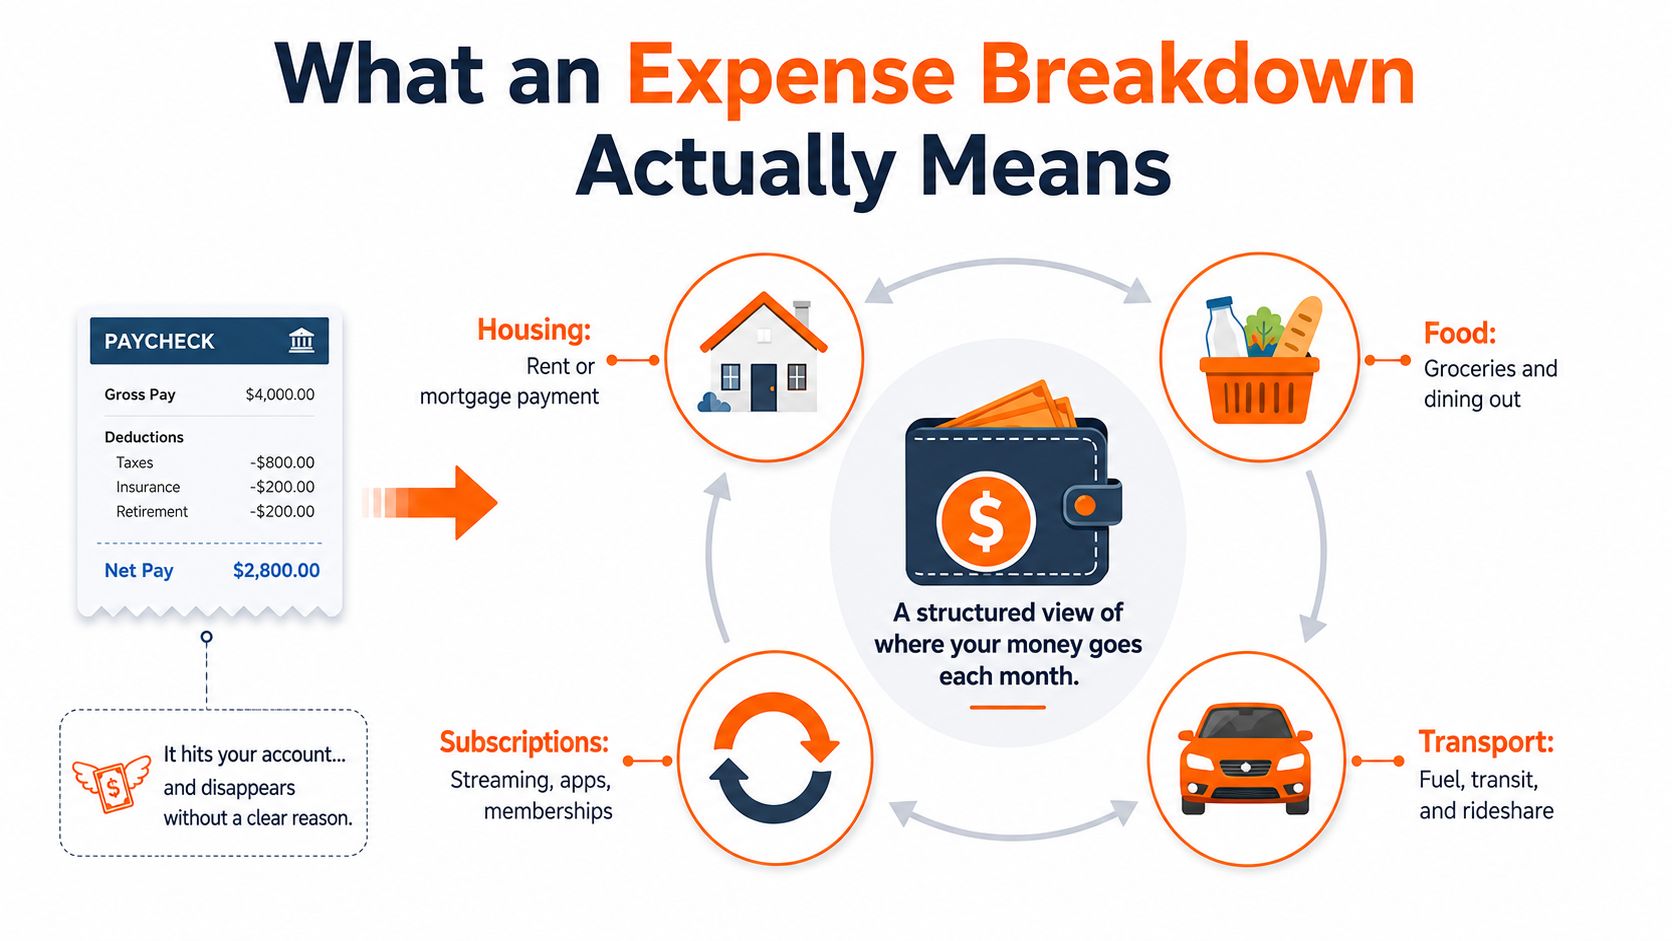
Simple definition: An expense breakdown is a structured view of where your money goes during a defined period.
A breakdown isn't the same as a budget. A budget is a plan for where your money should go. An expense breakdown is the record of where it went. You need the record before you can make a realistic plan, because otherwise your category limits are based on memory, guesses, or an ideal month that doesn't match your life.
The basic format
Start with these columns:
| Category | Amount | Share |
|---|---|---|
| Housing | $1,200 | 30% |
| Groceries | $450 | 11% |
| Transportation | $180 | 5% |
| Subscriptions | $90 | 2% |
| Other spending | $2,080 | 52% |
The figures above are only an illustration of the format, not a recommended spending target. Your useful categories and amounts will depend on your income, household, location, and obligations.
For a deeper explanation of the process, see what expense tracking means in practice. Once the raw record is organised, it becomes useful for cash-flow planning, budget adjustments, and savings decisions.
Why a Good Breakdown Changes Your Budget and Cash Flow
A clear breakdown changes the question from “Why am I always short?” to “Which category is using the cash I need next?” That shift helps you work with evidence instead of cutting random expenses.
The first benefit is leak detection. Five streaming services can add up to $75 a month, even when each individual charge feels minor. A grouped subscriptions category makes the total visible, so you can decide which services still earn their place.
The second benefit is cash-flow protection. Fixed obligations, such as housing, insurance, and loan payments, need to be funded before flexible spending. Separating the two helps you protect upcoming bills during a slower work period or an unusually expensive week.
What becomes clearer
| Question About Your Money | Before a Breakdown | After a Breakdown |
|---|---|---|
| Where did the money go? | You remember individual purchases | You see totals by category |
| What can change quickly? | Every expense looks similar | Flexible spending stands apart from fixed bills |
| Is the budget realistic? | Limits come from guesses | Limits reflect your actual history |
| Can I handle a new cost? | Headroom is unclear | You can compare the cost with available cash |
A fixed-cost ratio adds another useful warning signal. If needs consume more than 50% of take-home pay, the household has less room for surprises, so a car repair or rent increase can put pressure on the rest of the month. That threshold is a practical flag, not a universal rule, because income stability and household obligations differ.
A breakdown also lets you stress-test a decision. If a new payment would require cutting groceries, debt repayment, or savings, the numbers show the trade-off before you commit. For readers who want more detail on this connection, this guide to improving cash flow focuses on turning monthly movement into practical choices.
Teams managing more complicated financial processes may also find finance automation AI solutions useful as background on automated financial workflows. For a personal budget, the key principle is simpler: classify spending first, then decide what deserves a change.
Common Ways to Categorize Your Spending
The best categorization method depends on the question you're trying to answer. A needs-and-wants view helps you set priorities, fixed-and-variable labels help with cash flow, and activity-based categories show exactly where spending patterns are changing.
Needs, wants, and savings
The familiar 50/30/20 rule assigns 50% of after-tax income to needs, 30% to wants, and 20% to savings and debt repayment. Needs include housing, food, transportation, and child care, as described in this Canadian budgeting framework.
It's easy to use, which makes it helpful for a first-time budgeter. But it can be difficult to fit in a high-cost market. Statistics Canada data shows that Canadian households allocated 63.6% of consumer spending to shelter, transportation, and food combined in 2023, with shelter alone at 32.1%, transportation at 15.8%, and food at 15.7%. See the Statistics Canada household spending summary for the underlying categories.
Fixed and variable
Fixed costs tend to stay similar from month to month. Rent, insurance, loan payments, and many subscription charges fit here. Variable costs move with choices, timing, or usage, including groceries, dining out, entertainment, fuel, and rideshare trips.
This framework is usually the strongest starting point for cash-flow planning. You can protect the fixed bills, then adjust variable categories when the month becomes tighter.
Activity-based categories
Activity categories answer a different question: what are you spending on? Useful groups include housing, transportation, food, health, personal care, debt, savings, and subscriptions.
Statistics Canada's household spending framework goes further, capturing detailed lines such as utilities, repairs, communications, child care, vehicle costs, health care, clothing, education, recreation, gifts, and miscellaneous spending. Its household spending survey framework also supports comparisons using average expenditure, median expenditure per reporting household, and household incidence by province and territory.
| Method | Categories | Best For |
|---|---|---|
| Needs, wants, savings | Priorities and financial goals | Building a simple first budget |
| Fixed, variable | Stability and flexibility | Planning monthly cash flow |
| Activity-based | Housing, food, transport, health, and more | Finding trends and specific leaks |
The strongest combination for many is activity-based categories with a fixed-or-variable label on each line. If you're also exploring how savings can be organised after your spending is clear, a practical guide to automated yield with Yield Seeker can provide a separate starting point. You can find category ideas for a household in this guide to household budget categories.
Three Example Breakdowns You Can Copy Today
A finished breakdown should be easy to scan. Use one row per category, include the amount, and calculate each line as a share of net income or total spending. The three examples below use different household situations, so choose the structure that resembles your life rather than copying someone else's categories.
Example one for a single person
This monthly example uses $4,200 of take-home pay. The listed amounts include a 4% buffer, with each percentage calculated against income.
| Category | Monthly Amount | Share of Income |
|---|---|---|
| Rent | $1,250 | 29.8% |
| Groceries | $420 | 10.0% |
| Transit | $140 | 3.3% |
| Subscriptions | $87 | 2.1% |
| Dining | $210 | 5.0% |
| Savings | $630 | 15.0% |
| Buffer | $168 | 4.0% |
| Other categories and remaining spending | $1,295 | 30.8% |
| Total | $4,200 | 100% |
The point isn't to make every category fit a target. It's to expose the complete picture, including the amount that hasn't yet been assigned to a more specific category. If “other” becomes large, split it into personal care, health, debt, transportation extras, or another group that reflects your transactions.
Example two for a dual-income household
This household combines two paycheques into $6,900 of net income. Separate joint and personal lines where that helps, but keep shared obligations visible in the same monthly view.
| Category | Household Amount | Share of Income |
|---|---|---|
| Housing | $2,070 | 30.0% |
| Childcare | $690 | 10.0% |
| Utilities | $345 | 5.0% |
| Food | $966 | 14.0% |
| Transportation | $483 | 7.0% |
| Insurance | $345 | 5.0% |
| Debt payments | $483 | 7.0% |
| Savings | $1,035 | 15.0% |
| Discretionary spending | $483 | 7.0% |
| Total | $6,900 | 100% |
This layout shows both the household commitments and the flexible amount. Couples can add a note beside each row indicating whether the cost is shared, personal, or reimbursed.
Example three for a subscription-heavy budget
For a subscription-heavy household, create a dedicated recurring-charge sub-category. Include streaming, software, fitness, news, memberships, cloud storage, and similar services, then review the full list together rather than cancelling charges one at a time.
A common budgeting guide may suggest a recurring-charge target, but your own breakdown should be based on actual transactions. The useful output is a merchant list, renewal date, monthly equivalent, and decision status: keep, pause, cancel, or investigate.
Choose the first example if you budget alone, the second if several people share obligations, and the third if recurring charges are difficult to remember. The 50/30/20 budget rule overview can help you compare the finished breakdown with a broader allocation framework.
Metrics That Turn a Breakdown Into a Decision Tool
A list of expenses becomes more useful when you track the same measures every month. Keep the category names consistent, then compare the current period with earlier records.
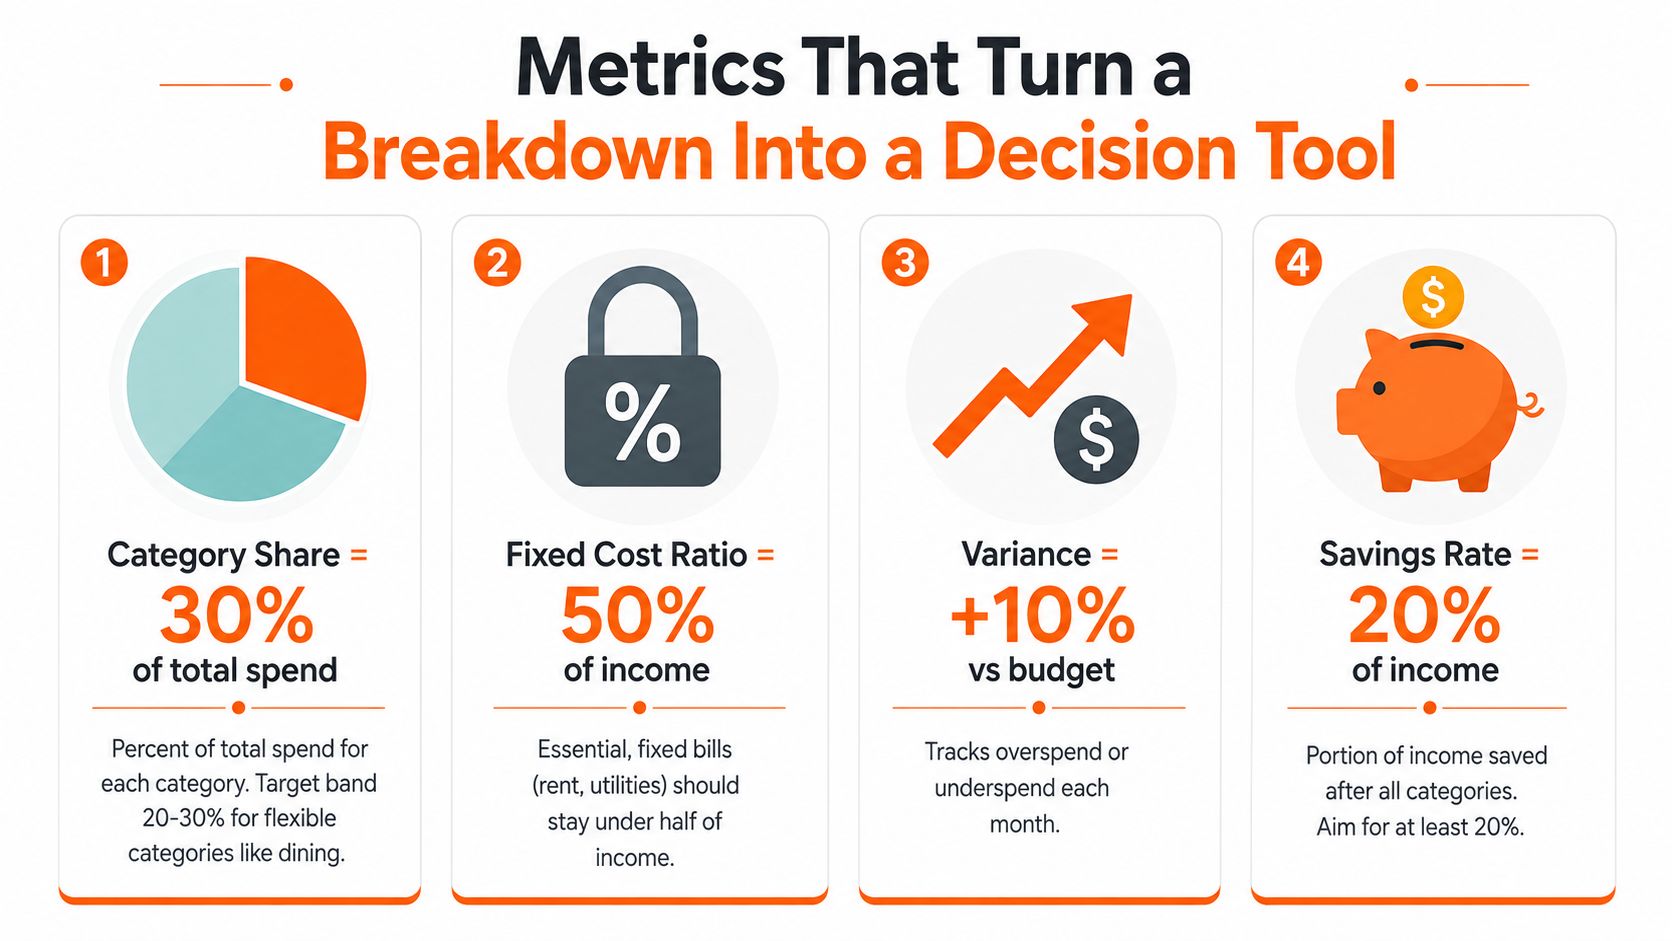
Category share
Category share is the category amount divided by the total spending amount, or by income if that's the base you've chosen. Housing at 30% or less is often used as a practical reference point, while flexible categories such as dining need a range that matches your priorities rather than a rigid universal limit.
If one category is unexpectedly high, inspect the transactions before cutting the whole category. A classification error may be hiding inside the total.
Fixed-cost ratio
Add rent or mortgage payments, insurance, minimum debt payments, and recurring subscriptions, then divide that total by take-home income. A result above 50% signals limited cash-flow flexibility.
When the ratio is high, look first for contract changes, renewal costs, insurance reviews, and subscriptions. Avoid treating every variable purchase as the cause of a structural problem.
Trend drift
Compare this month's category share with the prior three months. A gradual rise in groceries, dining, or transport can be easier to act on than a single unusually expensive purchase.
Mark the category that moved most, then identify whether the cause was price pressure, extra usage, a new recurring charge, or discretionary behaviour.
Savings rate
Your savings rate is the savings line divided by income. A 15% to 20% benchmark is commonly used for many earners, but the appropriate figure depends on debt, income stability, and near-term obligations.
If savings are below your chosen level, make one adjustment at a time. You might redirect a cancelled subscription, reduce a flexible category, or change the next month's target instead of trying to overhaul everything.
For readers who want a more formal way to think about planned versus actual spending, Fluidwave's cost variance guide explains the variance concept. The method only works when categories remain stable, because changing labels every month makes comparisons unreliable.
Tools and Workflows That Keep Your Breakdown Accurate
The hardest part of an expense breakdown isn't the first setup. It's keeping the record current after a busy week, an irregular bill, or a purchase that doesn't fit neatly into one category.
| Workflow | Setup Time | Ongoing Effort | Trend Visibility | Best For |
|---|---|---|---|---|
| Spreadsheet | Moderate | Moderate to high | Strong if maintained | Analytical users |
| Notebook or envelope method | Low | High | Limited | Tight cash budgets |
| Budgeting app | Moderate | Low to moderate | Strong | People wanting structure |
| AI expense tracker | Low to moderate | Low | Strong and current | Frequent card or bank users |
A spreadsheet gives you control. You can create custom formulas, add notes, and build charts, but formula drift can create errors, and missed entries can leave several weeks unrecorded.
A notebook or envelope method makes spending limits tangible. It works well for someone who prefers cash categories and a short list of weekly decisions, though it takes more effort to maintain a complete digital history.
Dedicated budgeting apps reduce repeated entry through bank-feed imports, category rules, and current totals. AI-driven expense trackers add automatic categorisation and natural-language questions, so you can ask where money went without manually scanning every transaction.
Match the workflow to your habits
Choose a notebook if you need a simple, physical limit for daily spending. Choose a spreadsheet if you enjoy analysing transactions and will reliably update it. Choose automated tracking if most of your spending already passes through an account and you want category totals to remain current between reviews.
Fintrack is one option in the automated category. Its transaction tools can organise logged spending into categories and present breakdowns and trends, while its manual-entry approach also suits people who don't want to connect a bank account. That matters for Canadian users who prefer to record transactions themselves or keep certain accounts separate.
A monthly account review still matters, even with automation. This account reconciliation guide explains how to check that the record agrees with the accounts you use.
A Simple Monthly Routine to Make It Stick
A breakdown becomes useful when it produces decisions on a regular schedule. Keep the routine short enough that you can repeat it even during a busy month.
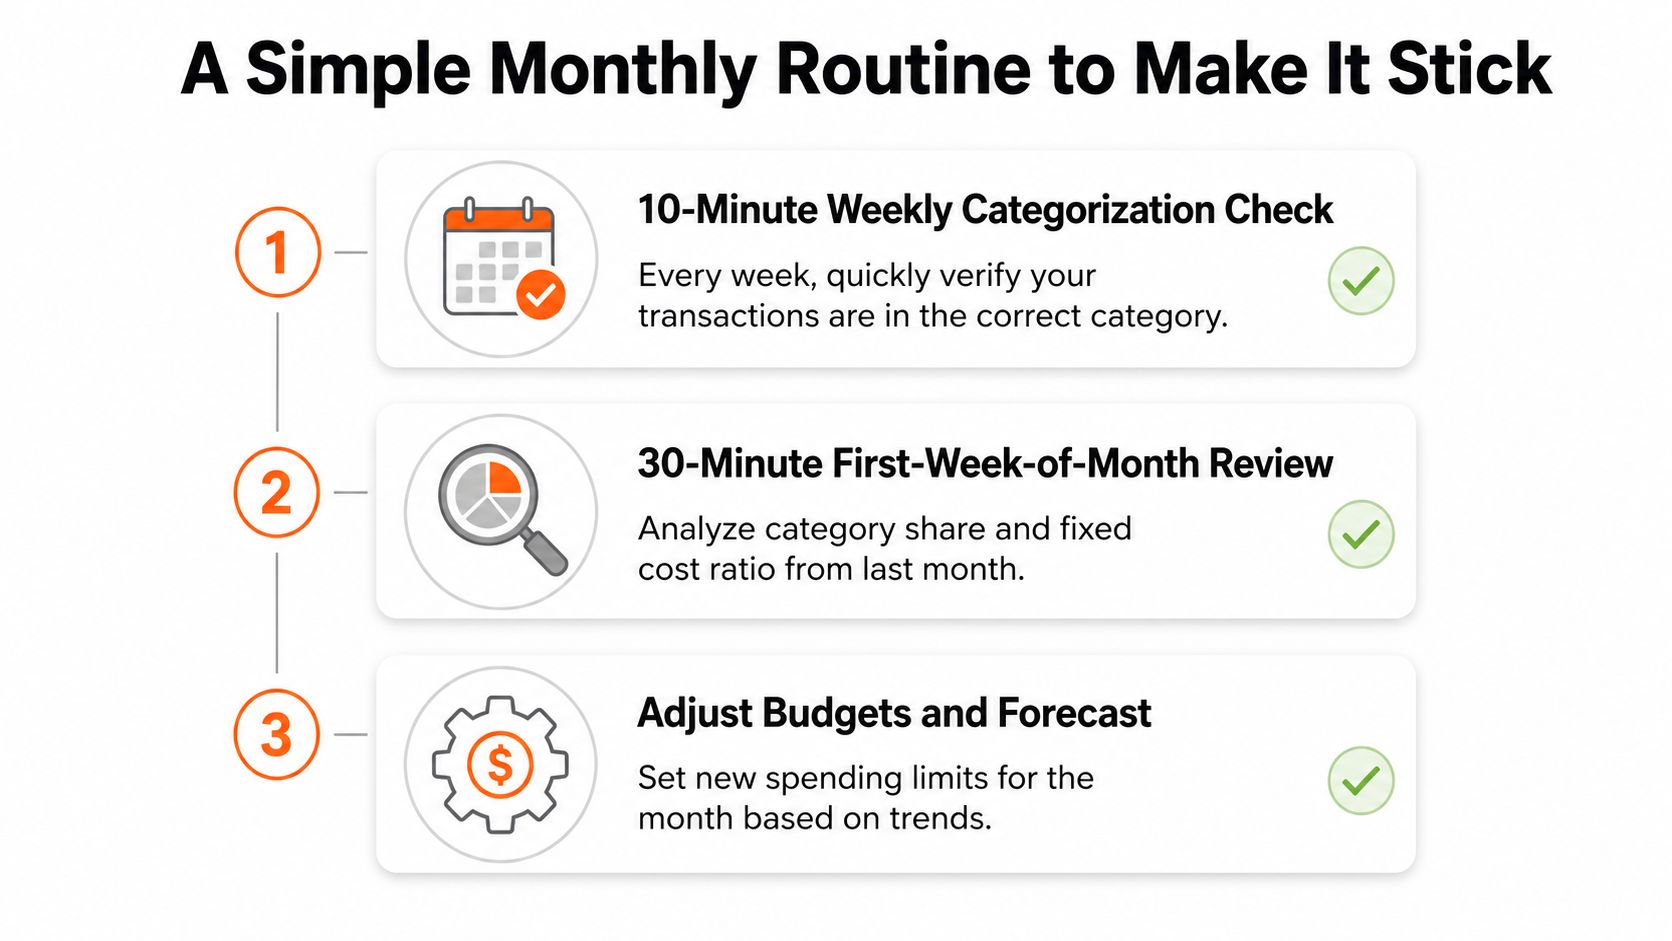
Spend 10 minutes each week checking categories. Verify that recent transactions have the right merchant and category. The output is an updated set of category totals, not a perfect financial plan.
Use 30 minutes in the first week of the month for review. Compare category share and fixed-cost ratio with the prior month. Write down two or three actions, such as reviewing a recurring charge, changing a grocery limit, or assigning an unallocated amount.
Spend 15 minutes midway through the month checking drift. Look at flexible categories such as groceries and dining before the month closes. Set one adjustment for next month's targets instead of trying to repair the current month with vague intentions.
Once your categories and merchants are learned, Fintrack's transactions feed can make these check-ins easier by keeping the record visible between reviews. Start with one month of complete entries, then use the results to make one or two deliberate changes.
Fintrack lets you organise expenses, review category totals, and track spending patterns without relying on a bank connection. Visit Fintrack to build your first expense breakdown and turn this month's transactions into a clearer plan for the next one.