The TD Monthly Income Fund Investor Series price was $31.16 per unit on October 1, 2026. That figure is a daily net asset value, or NAV, for one specific series, not a single price shared by every investor.
So, why can two Canadians search for the same fund and find different prices? The answer is that the TD Monthly Income Fund price depends on the series you own, while the more important decision usually involves the income you receive, the fees you pay, and your after-fee return.
A fund price can look stable and still tell you very little about whether the investment is meeting your needs. Before deciding whether to buy, hold, or sell, confirm the exact series, understand how distributions affect NAV, and look beyond the headline unit price.
What the TD Monthly Income Fund Price Actually Means
The quoted TD Monthly Income Fund price is the value of one unit in a particular series at the end of a trading day. TD calculates the NAV from the closing market prices of the fund's portfolio holdings, divided by the number of units outstanding. It isn't a stock-style quote created by a live exchange bid and ask.
That distinction matters. The Investor Series, identified by fund code TDB622, showed a NAV of $31.16 per unit on October 1, 2026, and the fund's total value was about C$9.07 billion on that date, according to TD's fund card for the I series. The NAV can change as the underlying bonds, equities, and other income-producing holdings change in value.

A simple way to read the number
Use this three-part check whenever you look up a quote:
- Identify the series. “TD Monthly Income Fund” isn't enough by itself. You need the series name or code attached to your units.
- Check the date. A NAV from one trading day may not be the current NAV.
- Read the distribution and fee details. A unit price alone doesn't show how much income you received or how much the MER reduced returns.
TD launched the Investor Series on June 29, 1998, giving it a history of more than 28 years as of October 2026. The fund's stated purpose is to provide a consistent level of monthly income, with capital appreciation as a secondary objective. If you're comparing performance, learn how rate of return is calculated instead of relying only on whether the unit price rose.
For broader guidance on checking a current quote, how to verify live market price is useful because it reinforces the importance of checking the instrument, date, and pricing source. For this fund, TD's official page should remain your starting point.
Why TD Monthly Income Fund Price Varies by Series
The most common mistake is treating every number in a search result as if it describes the same investment. A series is a separate class of units with its own pricing history, access rules, distribution arrangements, and expenses.
TD's Canadian fund pages show the following snapshots:
TD Monthly Income Fund Series and Pricing Snapshot
| Series | NAV per unit | Daily change | MER |
|---|---|---|---|
| A | $29.61 on September 29, 2026 | Not stated in the cited snapshot | 1.46% |
| I | $31.16 on October 1, 2026 | Down $0.04, or 0.13% | 1.48% |
| D | $16.15 on October 1, 2026 | Down $0.03, or 0.19% | Not stated in the cited snapshot |
| T8 | $11.68 on September 14, 2026 | Not stated in the cited snapshot | 1.48% |
The A, I, and T8 figures and MER information appear on TD's fund card for the A series and TD's T8 fund information. The D series information, including its price and asset base, is listed on TD's D series page.
These prices aren't directly comparable as a measure of which series is “better.” A lower unit price doesn't mean the fund is cheaper, safer, or delivering less income. It can reflect the series' launch history, distributions, and the way units have been issued or redeemed.
Practical rule: Track the series code shown on your statement, not just the fund name in a search result.
The D series began on October 20, 2015, while the Investor Series has existed since 1998. That different history alone can help explain why the unit prices don't line up. Your actual comparison should focus on the return of your own series, its MER, distribution record, and whether its access requirements fit your account.
How Monthly Distributions Affect the Unit Price
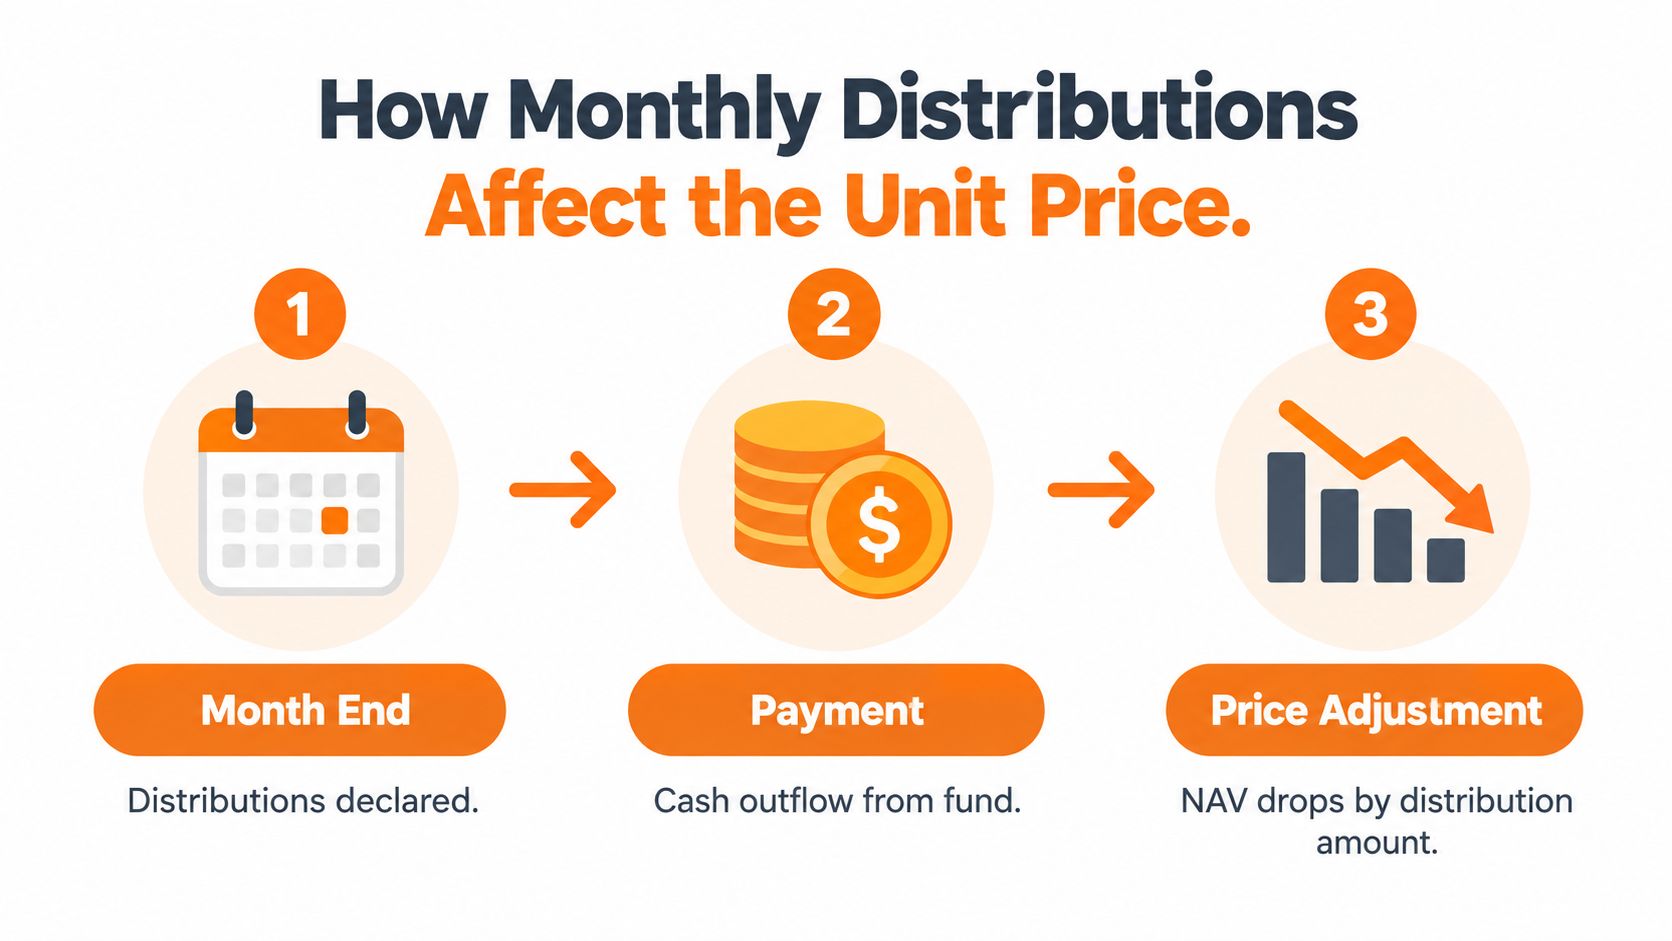
A monthly-income fund doesn't create income only by making its unit price rise. TD says distributions are made on or about each month end, and they're automatically reinvested unless the investor chooses to receive cash, as described in the TD Fund Facts document.
When a fund pays a distribution, cash leaves the fund. The NAV generally adjusts downward by approximately the amount distributed, all else being equal. That adjustment isn't automatically a loss. If you receive cash, you've moved value from the fund into your account. If you reinvest, you receive additional units at the adjusted NAV.
A practical example
Suppose your units are worth $1,000 before a distribution. After the fund pays income, the unit value may be lower, while you hold cash or additional reinvested units. Looking only at the new NAV could make the investment appear to have fallen even though you received a distribution.
The exact composition also matters. TD states that a distribution may include net income, net realized capital gains, and/or return of capital. Those components aren't interchangeable, so an investor should review the fund's tax and distribution information rather than assuming every payment represents ordinary investment income.
This is also why distribution history deserves attention alongside price history. A small daily NAV movement may be less important than whether the payments are consistent and how the total return looks after costs. For a general explanation of accounting considerations around funds, Blue Sage Tax & Accounting guidance can provide additional background, though your own tax adviser should address your circumstances.
You can also use this guide to finding a dividend when building a routine for checking income payments. Keep the records separate from the NAV so you can see both the value of your units and the cash flow they generated.
TD Monthly Income Fund Fees and After-Fee Returns
How much of the fund's return remains after costs and tax? The quoted TD Monthly Income Fund price shows the value of a unit, but it does not show the full amount you keep. The series you own, its MER, distributions, and your account's tax treatment all matter.
The MER works like a running cost built into the fund. TD explains that it covers management, operating, and tax-related expenses, and that these costs are deducted from the fund's returns rather than charged as a separate bill. The disclosed MER is 1.46% for the A series and 1.48% for the T8 and I series, according to TD's explanation of fund fees. TD also explains that MERs are calculated twice a year. Check the series name before comparing costs, because a price page for another series may show a different fee and result.
Why a stable price can hide a weaker result
A fund can show a steady-looking unit price while expenses reduce the return available to you. You may not see a transaction labelled “MER” in your account, but the cost is already reflected in the fund's reported performance.
Keep these three measures separate:
- Unit price: The value of one unit at the valuation point.
- Distribution: Cash paid to you or reinvested to purchase more units.
- Total return: The combined effect of price changes and distributions, after fund expenses.
Your after-fee result also depends on where you hold the fund. In a taxable account, the tax treatment can vary with the nature of the distribution and your personal circumstances. In a registered account, the reporting and tax consequences follow that account's rules. Review your statements and tax documents rather than treating every distribution as spendable income.
Fees deserve comparison because even a modest annual cost reduces the return left for you. Compare the fund's income objective with its MER, risk, distribution record, and total return. This overview of the CI High Income Fund offers another way to frame comparable income-fund questions, not a recommendation to switch investments.
Where and How to Find Current and Historical Prices
The reliable way to check the fund is to start with TD's official fund card and then select the exact series. Don't stop at a search snippet, because third-party pages can combine prices from different dates or display a different series from the one in your account.
Use this monthly checking routine
- Read your statement first. Find the series name or code attached to your units.
- Open the matching TD fund page. Confirm that the page title and series correspond to your holding.
- Check the currency. TD Monthly Income Fund is a Canadian-dollar mutual fund, so the quoted NAV is in CAD.
- Record the valuation date. A price without a date is incomplete.
- Note the distribution choice. Confirm whether your distributions are reinvested or paid in cash.
- Save the historical result. A simple record helps you compare income, NAV, and total return over time.
The Investor Series minimum initial investment is $100, and TD's Fund Facts state that no minimum subsequent investment applies for that series, subject to the fund's terms. Those operational details can matter just as much as the quote if you're making regular contributions.
For additional background on reading mutual fund performance, understanding fund returns with Futurecaps can help clarify why a single price snapshot doesn't tell the whole story. You can also review what data aggregation means before deciding how to combine statements, fund records, and personal cash-flow information.
Tracking TD Monthly Income Fund in Your Personal Finance Workflow
A useful tracking habit doesn't need to depend on live bank feeds or a complicated spreadsheet. Record the distribution date, amount received or reinvested, series, and account location each month. Then compare the income with recurring expenses, savings contributions, and the cash you need.

A manual workflow can be enough:
- Log the payment: Record whether the distribution arrived as cash or was reinvested.
- Categorise it clearly: Keep fund income separate from employment income, transfers, and withdrawals.
- Review the trend: Compare monthly income records with regular household spending.
- Check the full picture: Use NAV, distributions, MER, and account tax treatment together rather than judging one number.
A personal finance dashboard can make that review easier by placing income and expenses in the same view. This personal finance dashboard guide offers a practical framework for organising those records without relying on scattered notes.
Fintrack lets you manually record fund distributions and other income without connecting a bank account, then review them alongside your spending and goals. Visit Fintrack to explore its financial overview and AI assistant tools and turn your monthly income records into a clearer personal cash-flow review.