
You open a stock quote, spot a line like “Div/Yield,” and suddenly the screen feels more technical than helpful. You're not trying to become an analyst. You just want to know something simple. How much income could this investment pay me?
That's the right question.
Most dividend math looks harder than it is because investing websites compress several ideas into short labels. Once you unpack them, each number answers one practical question. How much will I get? Is the dividend supported by the business? How do I estimate what lands in my account over a year?
Why Dividend Numbers Are Simpler Than They Look
A lot of people assume dividends require advanced finance knowledge. In practice, the basic calculations are closer to everyday money math. You're usually working with a payment amount, a share count, a stock price, and sometimes earnings.
Imagine comparing rental properties. One person asks, “How much rent do I collect?” Another asks, “How expensive is the property compared with that rent?” A third asks, “Can the property comfortably support those payments?” Dividend investing uses similar questions, just with different labels.
The three questions behind the numbers
People exploring how to calculate dividends typically want to know one of these:
- Cash question: How much money does each share pay me?
- Comparison question: How much income am I getting relative to the stock price?
- Safety question: Is the company paying a reasonable share of its profits, or stretching too far?
That's why a stock page can look crowded. It isn't showing one dividend number. It's showing several related ones.
Practical rule: Don't memorise labels first. Start with the question you want answered, then match the formula to that question.
If you already understand how interest works, this gets easier. Dividend yield, for example, turns a cash payment into a percentage, much like savings interest helps you compare accounts. If that comparison mindset feels familiar, this plain-English guide on how interest works on a savings account is a useful mental bridge.
Why this matters for ordinary investors
Dividends matter because they make returns feel tangible. Price gains stay on paper until you sell. A dividend is cash paid out to shareholders.
That doesn't make every dividend stock good, and it doesn't mean a bigger yield is always better. It means dividend calculations give you a grounded way to evaluate income before you buy, and to track what your investments are doing after you own them.
The Four Essential Dividend Calculations
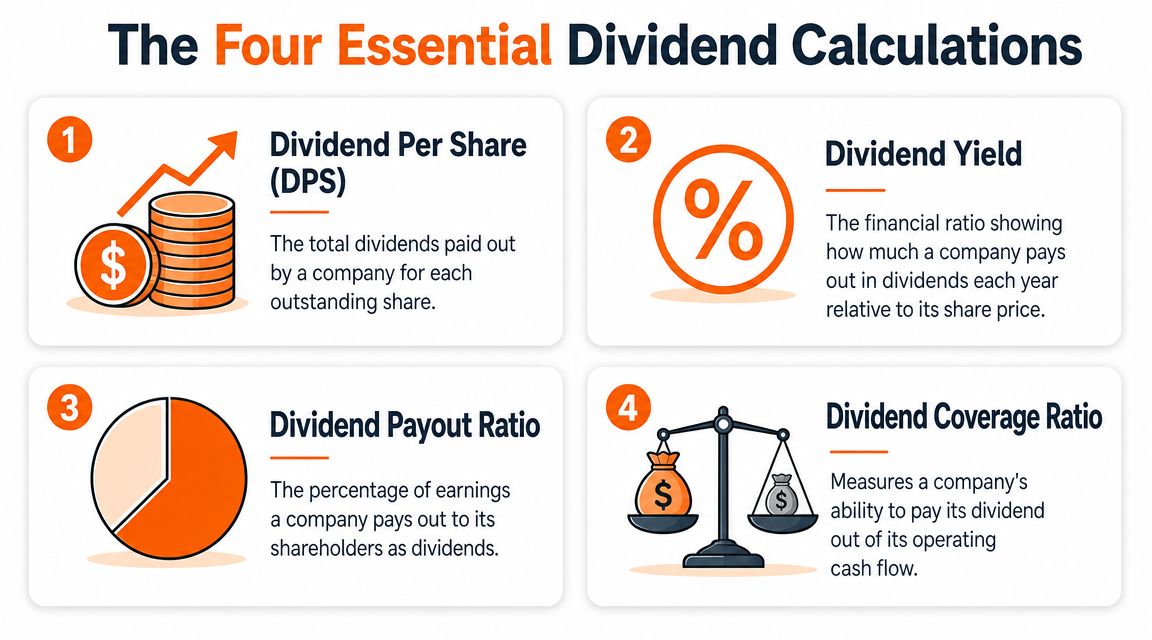
A good way to keep dividend math straight is to tie each number to a practical question. One formula answers, "How much will I get?" Another answers, "How much income am I getting for the price I pay?" Another helps with, "Is this dividend safe enough to trust?"
Once you sort the numbers by question, the math feels much less crowded.
Dividend per share
Dividend per share (DPS) answers: How much does one share pay?
This is the cash amount attached to each share you own. If a company paid four quarterly dividends over the last year, you can add them up to get the trailing annual dividend per share.
If you want a forward estimate, investors often annualise the latest quarterly dividend by multiplying it by 4. For example, if the most recent quarterly dividend is $0.50, a simple annual estimate is $2.00 per share.
It is similar to turning a weekly paycheck into a rough yearly salary estimate. It is not perfect, but it gives you a usable starting point.
Dividend yield
Dividend yield answers: How much income am I getting relative to the stock price?
The formula is:
Annual dividends per share ÷ current share price
Yield turns a dollar payment into a percentage, which makes comparison easier. A stock paying $1 per share with a $25 share price has a 4% yield. A different stock paying $2 per share with a $50 share price also has a 4% yield.
That is why yield matters. The raw dividend amount alone does not tell you whether one stock is offering more income for your money.
If you want extra practice with that comparison, this guide on how to calculate the dividend yield step by step walks through it in more detail.
Dividend payout ratio
Dividend payout ratio answers: Is this dividend supported by earnings?
The formula is:
Annual dividend per share ÷ earnings per share
This ratio shows how much of the company's profit is being paid out as dividends. If a company earns $10 per share and pays $3 per share in dividends, the payout ratio is 30%.
A lower ratio can suggest more room to maintain the dividend if business slows. A very high ratio can be a warning sign that the company is stretching to keep paying shareholders.
It is not a perfect safety test. Some businesses have stable cash flows and can support higher payout ratios than others. Still, this number gives you a fast way to check whether an attractive yield looks reasonable or risky.
Total dividend income
Total dividend income answers: How much money will my shares generate?
This is the most personal calculation:
Shares you own × annual dividend per share
If you own 100 shares and each share pays $2 annually, your estimated yearly dividend income is $200.
This is the number that connects stock research to your real life. It helps you estimate how much cash a position could add to your account over a year.
Here's a quick comparison:
| Calculation | What it tells you | Basic formula |
|---|---|---|
| Dividend per share | Cash paid per share | Annual dividend amount per share |
| Dividend yield | Income relative to stock price | Annual DPS ÷ share price |
| Payout ratio | Dividend support from earnings | Annual DPS ÷ EPS |
| Total dividend income | Cash you may receive | Shares owned × annual DPS |
A simple shortcut helps: use dividend per share for the cash question, yield for the comparison question, payout ratio for the safety question, and total dividend income for the personal planning question.
Putting the Formulas to Work with Examples
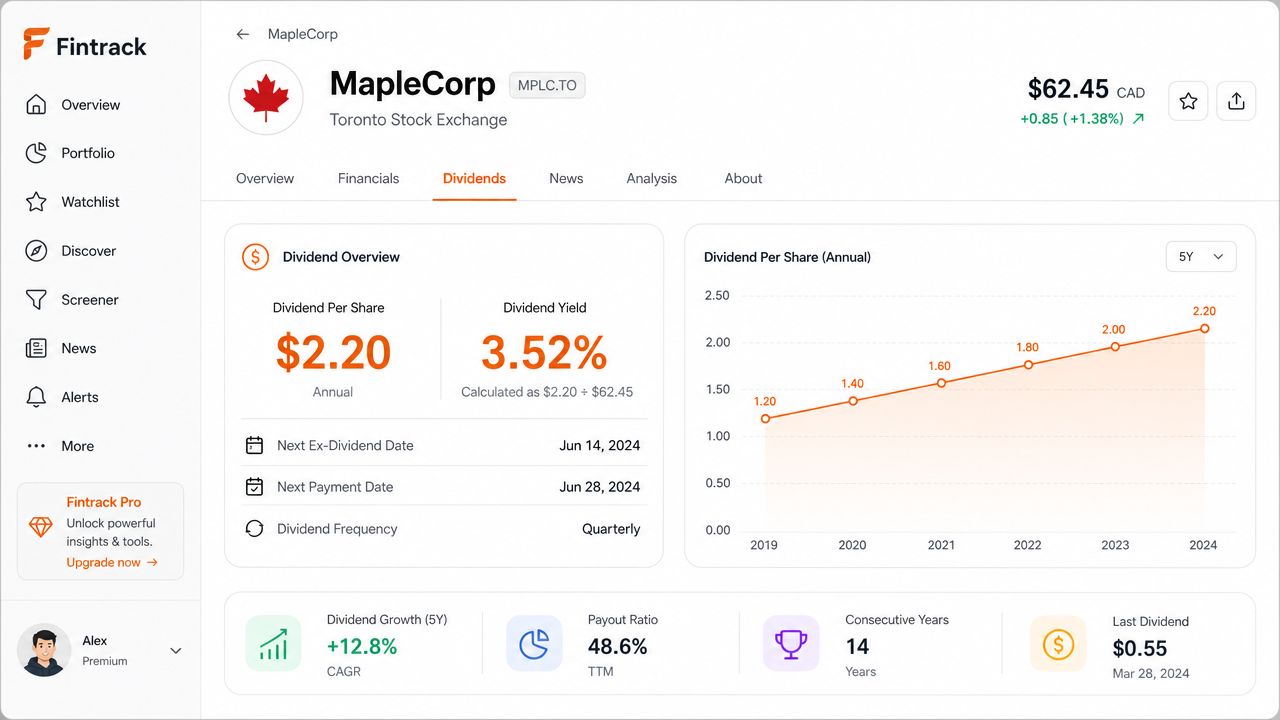
The formulas make more sense when you string them together the way a real investor would. Not as isolated definitions, but as a small decision process.
Example one with a single stock
Say you're researching one dividend-paying stock and want to estimate your annual income.
You start with the company's most recent quarterly dividend. To estimate annual dividend per share, you annualise that quarterly amount by multiplying by four. That gives you a forward-looking income estimate for one share over a year.
Then you ask:
How much does one share pay?
Use annual dividend per share.How much would my position pay?
Multiply annual dividend per share by the number of shares you plan to own.How attractive is the income compared with price?
Use dividend yield.Is the dividend supported by earnings?
Use payout ratio.
Applied together, the formulas provide different insights. One tells you cash. One tells you value relative to price. One helps you judge whether the business appears to be paying from a position of strength.
Example two with a small portfolio
Now make it more realistic. Investors typically don't hold just one dividend stock forever. They own a small mix.
For a mini-portfolio, repeat the same process for each holding:
- Find annual dividend per share for each stock
- Multiply by your share count for each holding
- Add the annual income amounts together
That final step gives you your estimated annual dividend income across the whole portfolio.
A lot of investors stop too early and only compare yields. That can be misleading. A stock with a headline yield that looks tempting may contribute less total cash if you own only a small position, or it may deserve extra caution if earnings support looks thin.
When you compare dividend stocks, don't ask only “Which yield is higher?” Ask “How much cash does this holding generate in my portfolio, and does the business appear able to keep paying it?”
If you want to stack this income analysis beside broader performance thinking, it also helps to understand rate of return, because dividend income is only one part of what an investment may deliver.
Calculating Growth with Dividend Reinvestment Plans (DRIPs)
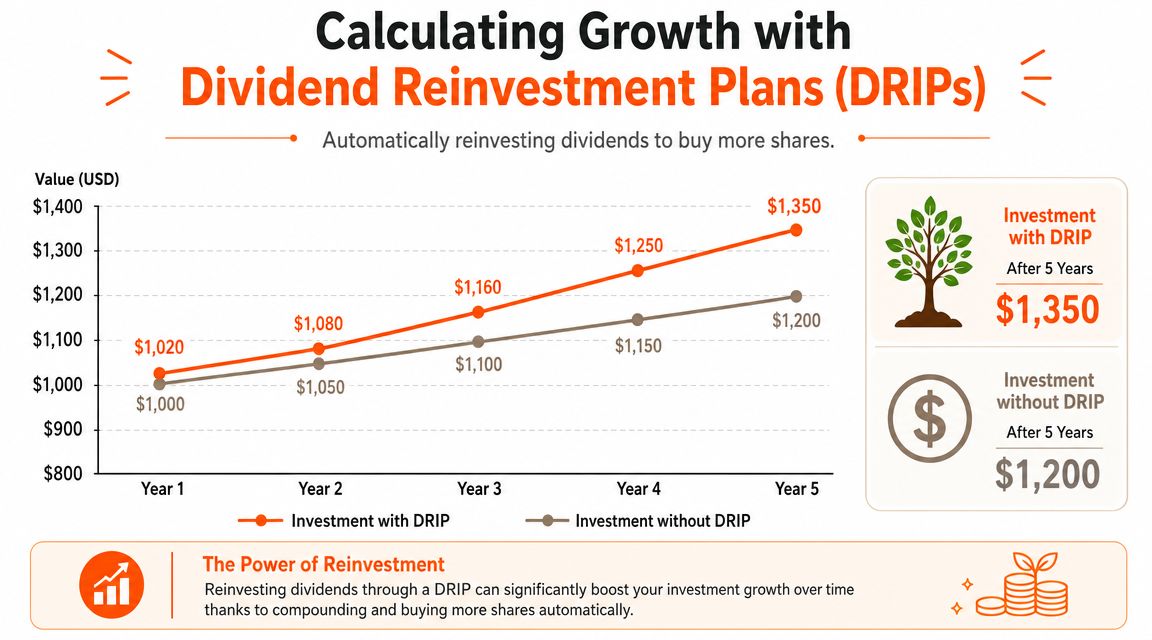
Some investors want dividends as spendable cash. Others want them to buy more shares automatically. That second path is what people mean by a Dividend Reinvestment Plan, or DRIP.
A DRIP takes the dividend payment you would have received in cash and uses it to purchase additional shares of the same investment. The result is simple but powerful. Your next dividend is then calculated on a slightly larger share count.
How the compounding works
The mechanics are straightforward:
- You own shares
- Those shares pay dividends
- The dividend buys more shares
- Those extra shares can earn future dividends too
That loop is the compounding engine.
Imagine it as planting seeds from your first harvest instead of eating everything right away. You give up some immediate cash, but you increase the number of income-producing units you own.
A simple way to estimate DRIP growth
You don't need a perfect projection to understand the idea. Start with your current share count and annual dividend per share. That tells you your expected dividend income.
Then imagine that dividend buying a fraction of a new share, or several new shares, depending on the stock price and the size of your position. On the next payment cycle, your share count is higher than before. That means your next dividend can be larger even if the dividend rate itself hasn't changed.
Here's the practical sequence:
- Estimate annual dividend income from your current shares
- Assume reinvestment into additional shares
- Use the new share count for the next income estimate
- Repeat over time
You can track this in a spreadsheet, in your brokerage records, or in portfolio software that shows reinvested distributions.
Where people get confused
The biggest misunderstanding is thinking DRIPs create extra money out of nowhere. They don't. The dividend is still your money. You're choosing to recycle it back into the investment instead of taking it as cash.
Another confusion point is that DRIPs can make income tracking messier. Once reinvestment starts, your share count changes over time, so your future dividend estimates should change too.
Reinvestment changes the question from “What did I get paid?” to “How many more income-producing shares do I own now?”
That shift matters because dividend investing isn't only about present income. For many long-term investors, it's also about building a larger income base over time.
Understanding Dividend Timing and Taxes
Knowing how to calculate dividends is useful, but timing matters just as much. You can estimate the payment correctly and still miss it if you don't understand the key dates.
The dates that matter
Investors usually run into four terms:
- Declaration date means the company announces the dividend.
- Ex-dividend date is the key cut-off date for eligibility.
- Record date is when the company checks its shareholder records.
- Payment date is when the dividend is paid.
For most investors, the ex-dividend date is the one worth watching closely. If you buy too late, you may not receive that upcoming dividend even if the stock page still shows a dividend amount.
The tax side for Canadian investors
Taxes add another layer. In Canada, eligible dividends and other dividend types can have different tax treatment, and the dividend tax credit can affect the after-tax result. The exact impact depends on your account type, province, and personal tax situation.
If you want a plain-language overview of how dividend taxation works in practice, the Stewart Accounting dividend tax guide is a helpful starting point. It isn't a substitute for personal tax advice, but it gives useful context.
For long-term planning, it also helps to understand the broader idea of tax deferral, especially if you hold dividend investments in registered versus non-registered accounts.
Common Mistakes and How to Track Your Income
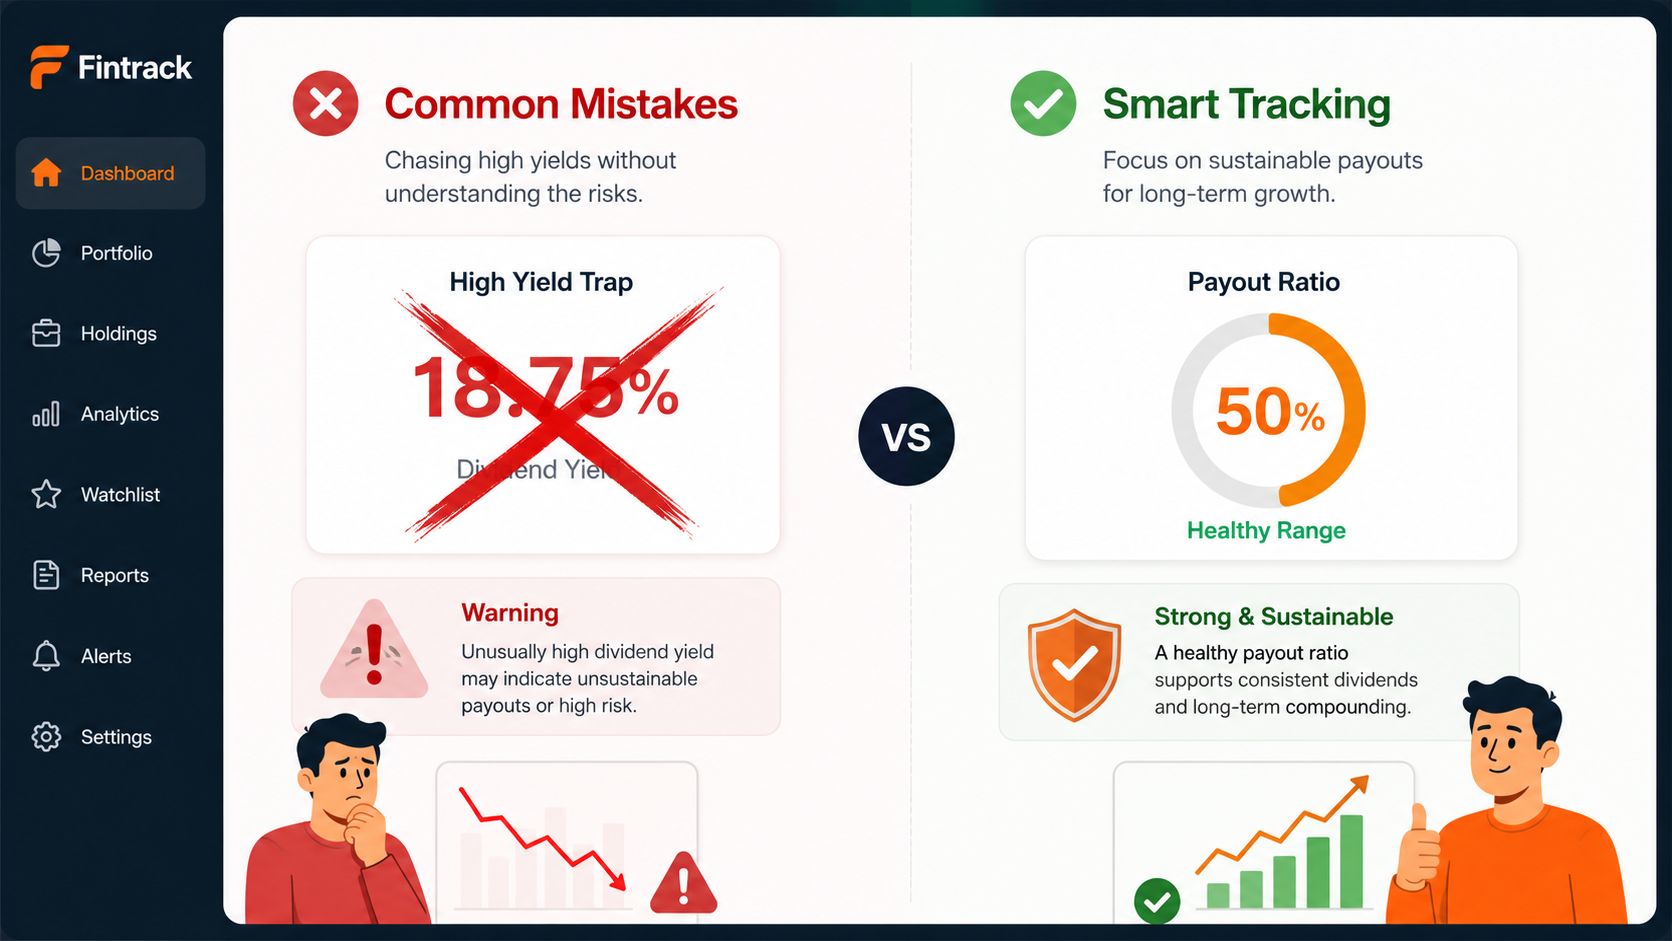
A lot of dividend errors happen after the math looks finished. You calculate the payment, feel confident, and then base a decision on a number that is incomplete or out of date.
The practical questions here are simple. How much will I really get? Is that income likely to hold up? And how do I keep track of it once the payments start arriving?
Two mistakes that trip up beginners
The first mistake is treating yield as the full story. A stock with a high yield can look like a bigger paycheck, but a bigger paycheck means little if the company may struggle to keep paying it. Yield answers one question. Payout ratio and business quality help answer the next one, which is whether that dividend looks safe enough to rely on.
The second mistake is annualising the dividend the wrong way. If a company pays quarterly, investors often multiply the latest quarterly dividend by 4 to estimate annual dividends per share. That quick check is useful, but only if the current payment is a fair snapshot of what the company is likely to keep paying. A one-time change can make the estimate misleading.
A simple tracking habit
Once you own dividend stocks or ETFs, your job shifts from calculating to tracking. A good record should help you answer three practical questions at a glance:
- How much cash came in
- Which holding paid it
- Whether you reinvested it or kept it as spendable income
- How that income changes from month to month
A simple spreadsheet can do this. So can an app that shows investment-related cash flow alongside the rest of your money. Fintrack can help you spot dividend deposits in the context of your broader finances, and a clear personal finance dashboard makes it easier to see whether those payments are growing, staying flat, or getting interrupted. If you want a more trade-by-trade record with notes and review tools, key trading journal features can help you compare different tracking setups.
Keep the habit small so you will stick with it. Record the date, the holding, the amount paid, and what you did with the cash. Over time, that log becomes your answer to a very practical investor question: “What is my portfolio paying me?”
The habit that keeps dividend investing clear is simple: calculate before you buy, then track after you own.
If you want to put this into practice, review your dividend deposits in Fintrack and group them with your other income sources. Seeing those payments inside your full monthly picture makes it easier to judge what your portfolio is contributing, and what you want to reinvest, spend, or plan around.